


Market Momentum: Your Weekly Financial Forecast & Market Prep
Issue 34 / What to expect Feb 24, 2025 thru Feb 28, 2025
In This Issue
Market-On-Close: All of last week’s market-moving news and macro context in under 5 minutes + futures-snapshots
The Latest Investor Sentiment Readings
Institutional Support & Resistance Levels For Major Indices: Exactly where to look for support and resistance this week in SPY, QQQ, IWM & DIA
Institutional Activity By Sector: Institutional order flow by sector including the top institutionally-backed names in those sectors. We break it all down and provide the key insights and take-aways you need to navigate institutional positioning this week.
Top Institutional Order Flow In Individual Names: All of the largest sweeps and blocks on lit exchanges and hidden dark pools
Investments In Focus: Bull vs Bear arguments for BEKE, DELL, SCHW
Top Institutionally-Backed Gainers & Losers: An explosive watchlist for day traders seeking high-volatility
Normalized Performance By Thematics YTD (Sector, Industry, Factor, Energy, Metals, Currencies, and more): which corners of the markets are beating benchmarks, which ones are overlooked and which ones are over-crowded
Key Econ Events and Earnings On-Deck For This Week

Market-On-Close
The past week in the U.S. financial markets was marked by volatility, sharp sell-offs, and concerns over economic indicators. Major indices experienced steep declines, reflecting investor anxiety over inflation expectations, corporate earnings, and regulatory developments. Global markets presented a mixed picture, while bond yields fluctuated in response to economic data and Federal Reserve expectations. With nearly two months of 2025 behind us, key market trends have begun to emerge, shaping the trajectory of equities, fixed income, and macroeconomic conditions for the months ahead.
Market Performance Overview
On Friday, the S&P 500 Index ($SPX) dropped -1.71%, the Dow Jones Industrial Average ($DOWI) fell -1.69%, and the Nasdaq 100 Index ($IUXX) plunged -2.06%. Futures contracts reflected similar declines, with March E-mini S&P futures (ESH25) down -1.70% and March E-mini Nasdaq futures (NQH25) down -2.07%. This sharp downturn was driven by a combination of corporate earnings disappointments, economic data misses, and growing inflation concerns.
The sell-off pushed the S&P 500 and Nasdaq 100 to one-week lows and the Dow Jones to a one-month low. Investors reacted negatively to earnings reports, particularly from Akamai Technologies, which tumbled more than -21% after issuing weaker-than-expected revenue guidance. Additionally, UnitedHealth Group fell more than -7% following reports that the U.S. Department of Justice had launched an investigation into its Medicare billing practices. A weaker-than-expected consumer sentiment report further weighed on investor confidence, reflecting growing economic concerns.
Key Economic Indicators and Their Market Impact
Several economic indicators released during the week contributed to the market's volatility:
Manufacturing and Services Activity: The U.S. February S&P Global Manufacturing PMI rose slightly to 51.6, an 8-month high, indicating modest expansion in the sector. However, the Services PMI unexpectedly fell to 49.7, marking the steepest contraction in two years.

Consumer Sentiment: The University of Michigan’s Consumer Sentiment Index for February was revised lower to 64.7, a 15-month low. Notably, long-term inflation expectations surged to a 29-year high of 3.5%, exacerbating fears of persistent inflation.

Housing Market Weakness: January existing home sales declined -4.9% month-over-month to 4.08 million, well below expectations of a -2.6% decline. High mortgage rates and affordability challenges continued to weigh on the housing market.


Interest Rates and Bond Market Movements
U.S. Treasury yields saw sharp declines as investors sought safe-haven assets amid equity market turmoil. March 10-year Treasury notes (ZNH25) closed up, with the yield falling by -9.1 basis points to 4.414%. European bond markets also saw declines in yields, with the 10-year German bund yield falling -6.4 basis points to 2.470% and the UK gilt yield dropping -3.6 basis points to 4.571%.
Expectations for a Federal Reserve rate cut in March remained low, with market pricing reflecting only a 6% probability of a -25 basis point cut at the next FOMC meeting on March 18-19. However, softening economic data and persistent inflation fears have raised speculation about potential policy adjustments later in the year.
Global Market Performance
Overseas markets provided a more optimistic picture. The Euro Stoxx 50 closed up +0.25%, while China’s Shanghai Composite climbed to a 7-week high, closing up +0.85%. Japan’s Nikkei 225 rebounded from a 2-1/2 week low to finish up +0.26%. These gains contrast with the struggles in U.S. equities and suggest that international markets may be benefiting from different macroeconomic dynamics and policy expectations.
Three Key Market Trends Emerging in 2025
1) Mega-Cap Technology Stocks Lagging
In contrast to their leadership in 2024, mega-cap technology stocks have underperformed broader markets in 2025. The "Magnificent 7" stocks—Apple, Amazon, Google, Meta, Microsoft, Nvidia, and Tesla—drove over 50% of the S&P 500’s returns last year, but only two of them have outperformed the index this year. This shift reflects stretched valuations, trade uncertainties, and a more balanced earnings outlook across sectors.


2) Stabilization of Treasury Yields
After surging to nearly 4.8% in early January, the U.S. 10-year Treasury yield has stabilized around 4.5%. The recent moderation has been driven by contained inflation data, expectations of potential Fed rate cuts, and concerns over slowing economic growth. Retail sales weakness, cautious corporate guidance, and growing layoffs could prompt policymakers to reconsider their stance later in the year.

3) Global Markets & European Equities Outperforming
European stock markets have outpaced U.S. markets in early 2025, with the Euro Stoxx 50 rising approximately 13% year-to-date. This performance has been driven by a weaker U.S. dollar, improving economic data in the Eurozone, and hopes of geopolitical stability in the region. However, sustainability remains uncertain, and investors are watching developments closely.

Investor Sentiment and Market Outlook
Despite recent market turbulence, the broader trend has been one of resilience. The S&P 500 remains up approximately 4% for the year, and the MSCI World Index has gained around 5%. Diversification remains a critical theme for investors in 2025, with opportunities emerging in mid-cap stocks, fixed income, and international equities. However, potential risks from inflation, tariffs, and economic slowdowns warrant careful portfolio positioning.

The upcoming weeks will be pivotal, with major data releases—including the January Personal Consumption Expenditures (PCE) Price Index and earnings from Nvidia—set to influence market direction. While the Federal Reserve appears committed to holding rates steady for now, shifts in inflation expectations or economic growth could alter the policy outlook in the months ahead.
Conclusion
The past week has underscored the complexity of navigating financial markets in 2025. While the equity markets have faced short-term headwinds, underlying trends suggest a broadening of market leadership beyond mega-cap technology, a potential stabilization in interest rates, and renewed strength in international equities. As investors digest economic data, corporate earnings, and policy signals, maintaining a diversified and balanced approach remains the best strategy for weathering market fluctuations in the months to come.

5-Day Futures Performance Leaders

S&P 500 Sector Insights
Sector Overview With Individual Names By Market Cap

5-Day Sector Leaderboard

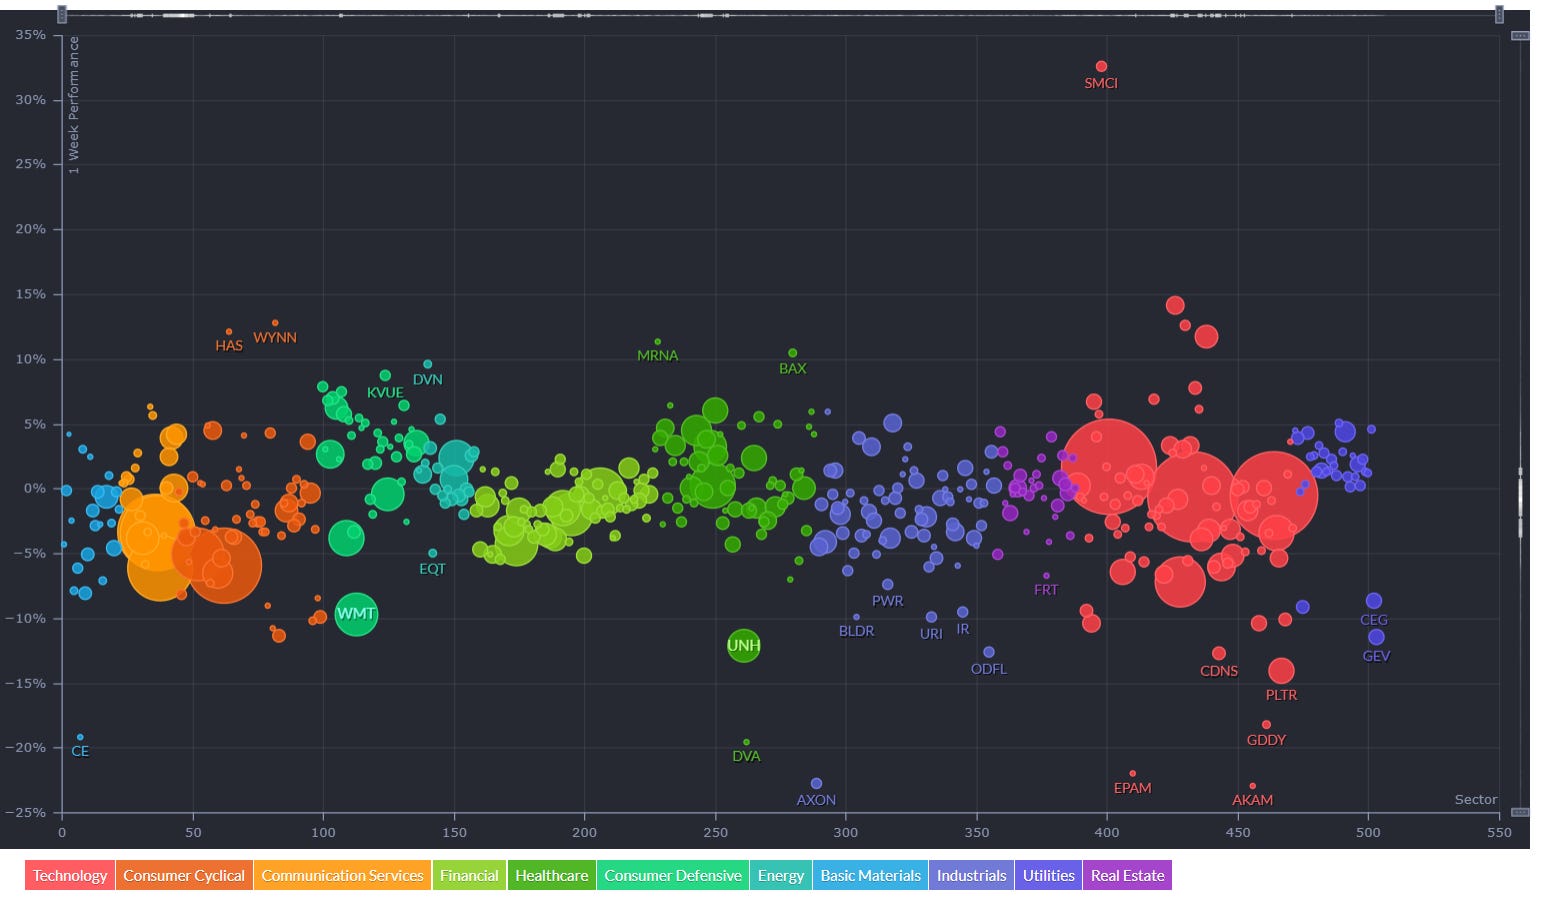
5-Day Individual Performance Grouped By Sector (Size By Market Cap)
ETF Insights
Reviewing a heatmap like this weekly can be incredibly helpful for investors as it provides a quick and visual summary of market performance across various sectors, asset classes, and geographies.
1. Sector and Asset Class Trends
Identify Strong and Weak Sectors: Investors can quickly spot which sectors (e.g., technology, energy, healthcare) are performing well or underperforming.
Asset Class Diversification: Seeing how commodities, fixed income, equities, and cryptocurrencies performed helps assess diversification.
2. Market Sentiment
Risk-On or Risk-Off: A green-dominated map suggests bullish sentiment, while red indicates bearish sentiment. Investors can align their strategies accordingly.
Volatility Indicators: Observing movements in volatility indices (e.g., VIX) can highlight changing market dynamics.
3. Regional Analysis
Global Insights: Performance in developed and emerging markets (e.g., Europe, China, Asia-Pacific) helps in gauging international investment opportunities or risks.
Currency Impacts: Movements in forex or country-specific ETFs can indicate currency-driven market trends.
4. Thematic Trends
Growth vs. Value: Comparing the performance of growth ETFs (e.g., VUG) versus value ETFs (e.g., VTV) reveals the prevailing market preference.
Industry Leadership: Highlighting leadership within industries (e.g., gold miners, semiconductors) can inform thematic plays.
5. Monitoring Investments
Portfolio Alignment: Investors can track how their existing investments or watchlist align with broader market trends.
Rotation Signals: Seeing week-over-week changes in sector dominance may signal sector rotation opportunities.
6. Risk Management
Recognizing Overbought/Oversold Conditions: Consistent underperformance or overperformance in specific areas may indicate potential mean-reversion trades.
Correlation Awareness: By observing how different asset classes move, investors can manage portfolio correlation and risk.
7. Decision Support
Identify Outperformers/Underperformers: ETFs, sectors, or indices that repeatedly outperform or underperform can help refine trading or investment strategies.
Macro Perspective: Weekly trends highlight macroeconomic or geopolitical influences affecting markets.
Regularly reviewing a heatmap like this is a strategic practice that supports data-driven decision-making while fostering a holistic understanding of market dynamics.

Global Overview
Foreign ADR stocks listed on NYSE, NASDAQ & AMEX categorized by geographic location. Reviewing a global heatmap like this weekly is valuable for investors because it offers insights into international markets, helping to:
Identify Global Trends: Spot which regions or countries are performing well or underperforming.
Assess Sector and Regional Performance: Understand how industries are faring across different regions.
Diversify Portfolios: Uncover opportunities in emerging or developed markets for greater diversification.
Gauge Global Sentiment: Recognize the impact of macroeconomic events on specific regions.
Align with Global Strategies: Refine investment strategies based on regional strengths or weaknesses.
This overview ensures investors stay informed about global opportunities and risks, complementing their domestic market analysis.

Want to keep reading? Interested in knowing when institutions are positioning for a move and which names they are in? Sign-up today for the only platform delivering critical context into institutional order flow 👇👇👇

Thank you for being part of our community and for taking the time to read this publication. Your engagement and insights mean a great deal to all of us, and we're genuinely grateful to share this space with such dedicated and thoughtful readers. Wishing you a productive and successful week ahead in the markets. May the coming days bring clarity and great opportunities. Happy trading!