Market Momentum: Your Weekly Financial Forecast & Market Prep
Issue 35 / What to expect March 03, 2025 thru March 07, 2025
In This Issue
Market-On-Close: All of last week’s market-moving news and macro context in under 5 minutes + futures-snapshots
The Latest Investor Sentiment Readings
Institutional Support & Resistance Levels For Major Indices: Exactly where to look for support and resistance this week in SPY, QQQ, IWM & DIA
Institutional Activity By Sector: Institutional order flow by sector including the top institutionally-backed names in those sectors. We break it all down and provide the key insights and take-aways you need to navigate institutional positioning this week.
Top Institutional Order Flow In Individual Names: All of the largest sweeps and blocks on lit exchanges and hidden dark pools
Investments In Focus: Bull vs Bear arguments for SPOT, ENPH, PDD
Top Institutionally-Backed Gainers & Losers: An explosive watchlist for day traders seeking high-volatility
Normalized Performance By Thematics YTD (Sector, Industry, Factor, Energy, Metals, Currencies, and more): which corners of the markets are beating benchmarks, which ones are overlooked and which ones are over-crowded
Key Econ Events and Earnings On-Deck For This Week

Market-On-Close
The past week in U.S. financial markets was a whirlwind of economic data releases, geopolitical concerns, and shifting investor sentiment. Stock indexes exhibited significant volatility, swinging between gains and losses before closing the week with modest recoveries. Inflation remained a focal point, with the Fed’s preferred gauge—the core Personal Consumption Expenditures (PCE) index—matching expectations but doing little to dispel uncertainty about future monetary policy. Meanwhile, bond yields fell to multi-month lows, reflecting a complex interplay of economic slowing, policy uncertainty, and investor risk aversion.
Markets React to Inflation Data and Growth Concerns
The S&P 500, Dow Jones Industrial Average, and Nasdaq 100 all ended the week higher after enduring turbulence. On Friday, the S&P 500 ($SPX) climbed 1.59%, the Dow Jones ($DOWI) gained 1.39%, and the Nasdaq 100 ($IUXX) advanced 1.62%. Futures markets also reflected optimism, with March E-mini S&P futures (ESH25) up 1.45% and March E-mini Nasdaq futures (NQH25) rising 1.47%.
Much of the relief rally stemmed from January’s core PCE data, which came in at 2.6% year-over-year—the lowest annualized increase in nearly four years. Investors viewed the data as an indication that the Federal Reserve may be on track to cut interest rates later this year, a sentiment further bolstered by declining Treasury yields. The benchmark 10-year T-note yield dropped to a 2.5-month low, providing support to equities.
However, the week was anything but smooth. A surprise decline in U.S. personal spending for January, down 0.2% month-over-month, raised concerns about consumer resilience. While personal income increased by 0.9%—the biggest jump in a year—the decline in spending suggested that Americans may be tightening their wallets in response to inflationary pressures and economic uncertainty.
Adding to the week’s drama, a meeting between former President Trump and Ukrainian President Zelensky was abruptly canceled due to disagreements, rekindling geopolitical tensions. Markets briefly turned lower on the news, highlighting how fragile sentiment remains.
Tariff Fears Resurface
Trade policy once again entered the spotlight as President Trump announced plans to impose 25% tariffs on Canada and Mexico starting March 4, along with an additional 10% tariff on China. Investors reacted negatively to the news, fearing that escalating trade barriers could weigh on global supply chains and corporate profit margins. Given that the previous round of tariffs during Trump’s first administration had far-reaching effects on markets, this latest announcement added another layer of uncertainty to an already jittery environment.
Tech Sector Struggles and a Shift in Market Leadership
One of the most notable themes of the past week was the underperformance of the so-called Magnificent 7—mega-cap tech stocks that have led the market higher over the past two years. With six of the seven companies lagging the broader market, their leadership appears to be waning. NVIDIA, widely regarded as a bellwether for artificial intelligence (AI), reported stellar earnings with a 78% revenue jump year-over-year, but its stock fell 8.5% as investors deemed the results as merely "good" rather than "extraordinary."

The sharp pullback in big tech has led to a broadening of market leadership, with sectors like health care, financials, and consumer staples showing relative strength. The S&P 500 Equal Weight Index (SPXEW), which assigns equal weighting to all index components, is up over 1% year-to-date, while the market-cap weighted S&P 500 has been flat.
Sentiment Takes a Hit
Investor and consumer sentiment soured further last week, reflecting heightened uncertainty around economic growth and inflation. The Conference Board’s Consumer Confidence Index for February dropped to 98.3, marking its sharpest monthly decline since August 2021.

Perhaps more concerning was the index’s expectations component, which fell below 80—a level historically associated with recessionary conditions. Inflation expectations also ticked higher, with survey respondents forecasting 6% price increases over the next year, up from 5.2% in January.

Bond Market Signals and Treasury Yields
While stocks wavered, the bond market painted a picture of growing economic caution. The 10-year Treasury yield fell to 4.19%, its lowest level in nearly three months, reflecting strong demand for safe-haven assets. The yield curve inversion between the 10-year and 3-month Treasuries—a closely watched recession indicator—deepened further, raising concerns about slowing growth.
Bitcoin and the Crypto Market Selloff
The crypto market was not immune to the week’s turbulence. Bitcoin tumbled 12% to $84,500, extending its February decline to 18%. The slide was driven by a combination of profit-taking, increased regulatory scrutiny, and broader risk-off sentiment in financial markets.
Earnings Scorecard: A Silver Lining?
Despite macroeconomic headwinds, corporate earnings continued to impress. With 95% of S&P 500 companies having reported Q4 results, aggregate earnings grew by 18%—the highest rate in three years. The financial sector led the charge with a 56% earnings gain, while other sectors such as industrials and consumer staples also delivered strong results. This earnings resilience suggests that, despite near-term market volatility, corporate America remains in good shape.
Looking Ahead: Volatility Likely to Persist
As markets head into March, several key questions remain unresolved:
Will the Fed cut rates in 2025? Market pricing currently assigns only a 7% chance of a 25-basis-point cut at the next FOMC meeting, but expectations could shift if inflation continues to ease.
How will trade policy evolve under the Trump administration? The threat of tariffs remains a wildcard that could disrupt supply chains and dampen investor confidence.
Can the Magnificent 7 regain their leadership role? Or will markets continue to broaden out toward cyclical and value stocks?
Market history suggests that periods of volatility and sector rotation are normal components of long-term investing. While a correction of 10% or more has not occurred in over a year, the S&P 500’s sideways movement over the past three months may be acting as a stabilizing force. Investors who focus on balance and diversification may be better positioned to weather near-term market fluctuations while capturing long-term opportunities.
For now, uncertainty remains the dominant theme. But with inflation slowly easing, corporate earnings proving resilient, and monetary policy likely to remain accommodative, there are reasons to believe that the bull market still has room to run. The key, as always, will be navigating the noise and maintaining a disciplined, long-term investment approach.

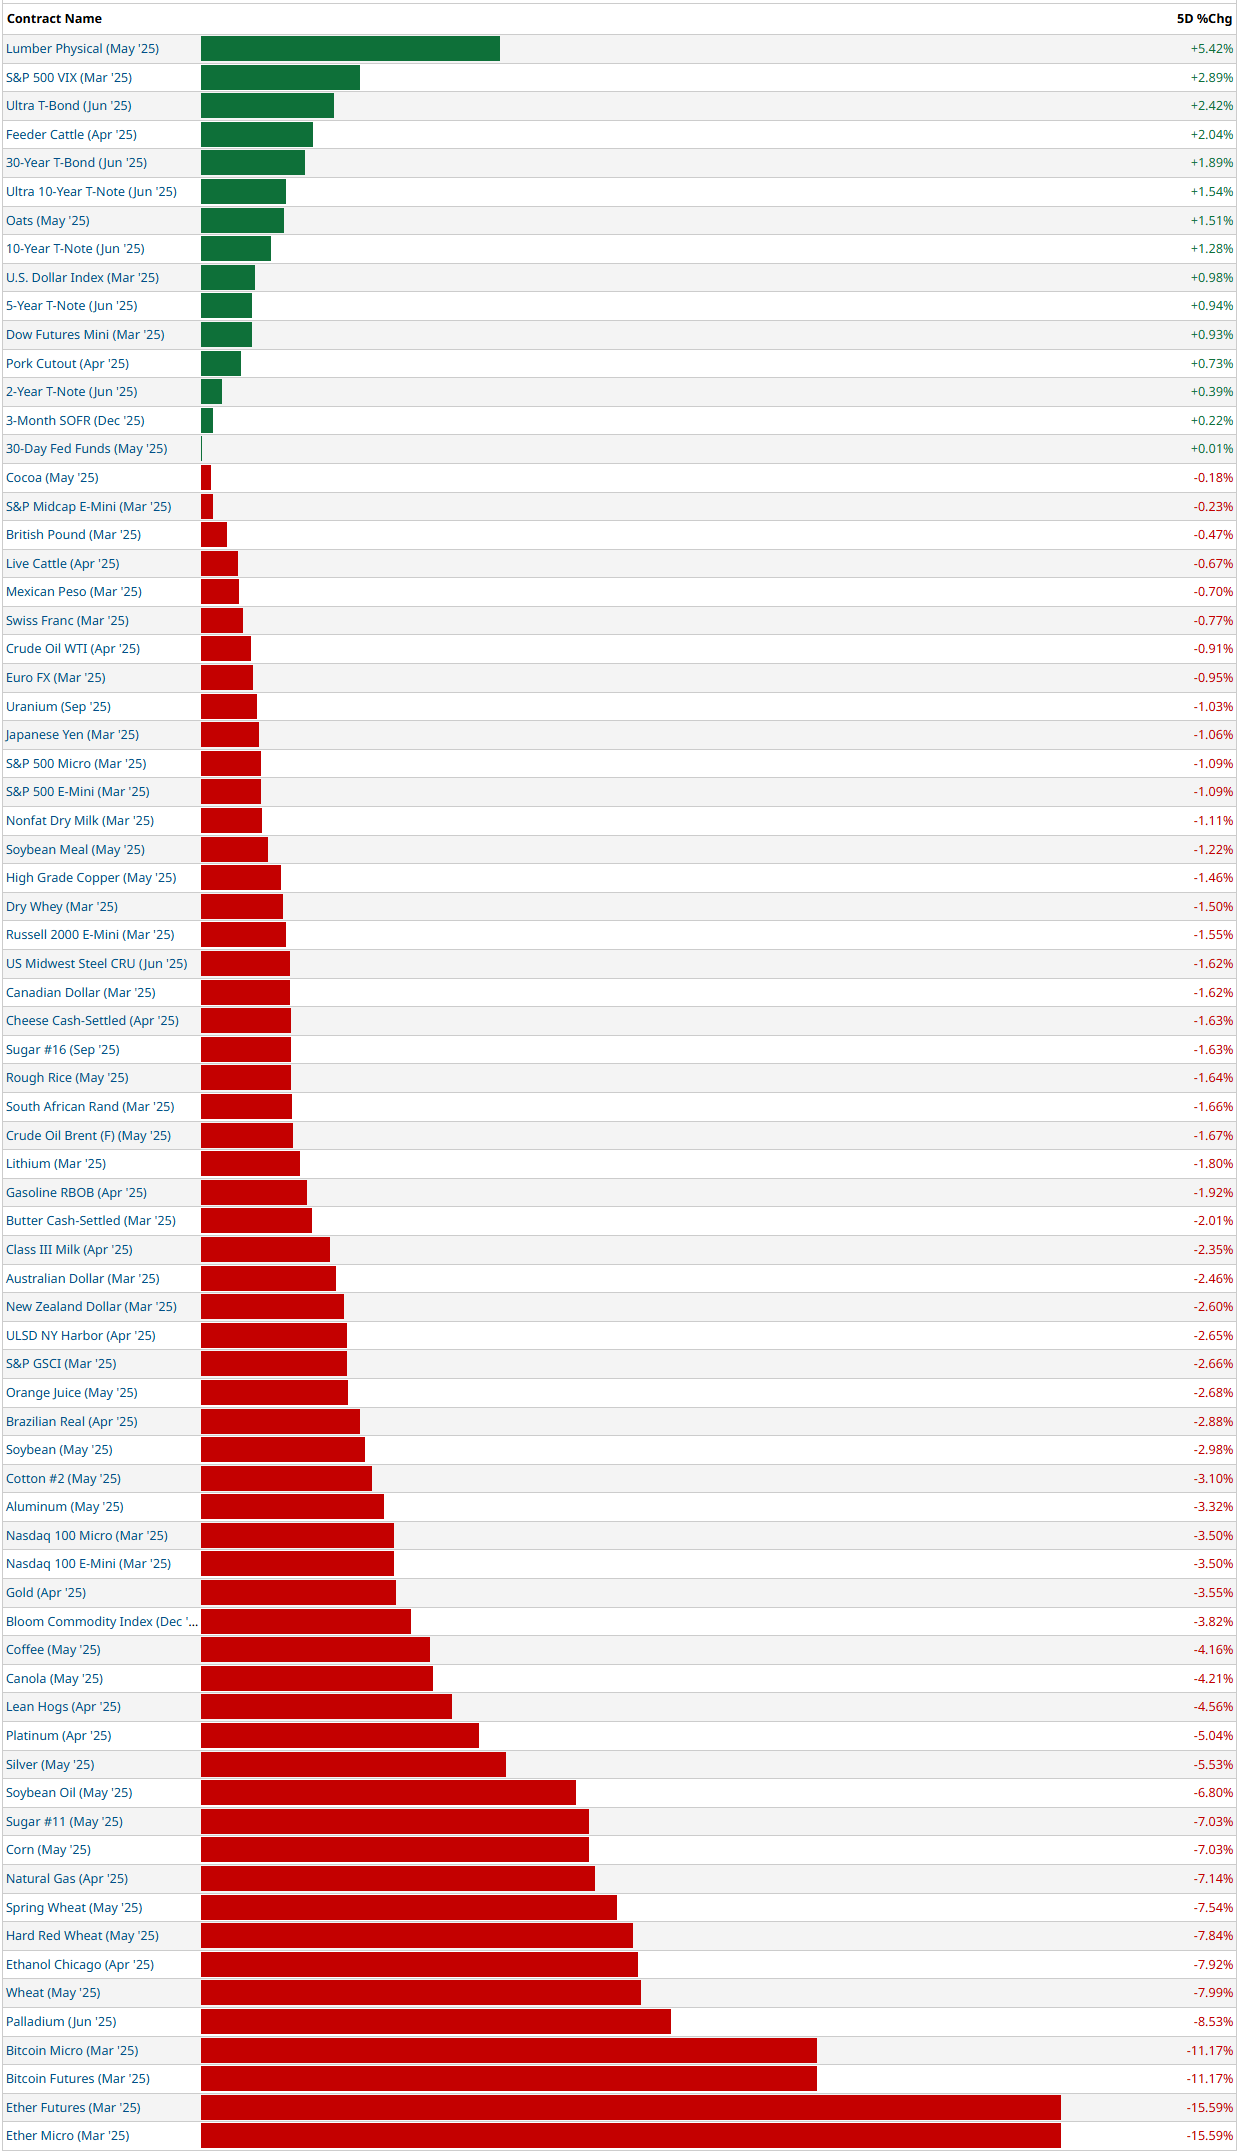
5-Day Futures Performance Leaders
S&P 500 Sector Insights
Sector Overview With Individual Names By Market Cap

Sharp Tech Sector Weakness: Technology stocks are experiencing significant declines, particularly in semiconductors with NVDA (-7.07%) and AVGO (-8.79%) showing substantial losses. Other major tech names like MSFT (-2.75%), AAPL (-1.51%), GOOG (-5.16%), and META (-2.25%) are also negative.
Extreme Tesla Decline: TSLA shows a dramatic -13.27% drop, significantly underperforming even other negative sectors, suggesting company-specific issues beyond general market trends.
Financial Sector Strength: Financial stocks are displaying remarkable resilience with Berkshire Hathaway (BRK-B +7.33%), Visa (V +4.07%), and Mastercard (MA +3.37%) leading the gains. This indicates a potential sector rotation from growth to value.
Healthcare Outperformance: Pharmaceutical companies like Eli Lilly (LLY +5.37%), Merck (MRK +3.07%), and AbbVie (ABBV +3.44%) are showing strong positive returns, reinforcing a shift toward defensive sectors.
Consumer Defensive Strength: Companies like Walmart (WMT +4.04%), Procter & Gamble (PG +2.12%), and Home Depot (HD +2.93%) are performing well, further confirming the rotation to defensive and value-oriented names.
Industrials Mixed Performance: This sector shows a mix of gains and losses with some aerospace & defense names like RTX (+7.07%) performing exceptionally well.
Energy Stocks Resilient: Most energy names are holding up relatively well despite recent commodity price volatility, with companies like XOM (+0.88%) in positive territory.
Clear Risk-Off Sentiment: The overall pattern shows investors moving away from high-growth, high-valuation technology stocks toward more stable, dividend-paying sectors like financials, healthcare, consumer staples, and utilities.
Magnitude of Divergence: The stark contrast between the worst performers (deep red in tech) and best performers (bright green in financials/healthcare) suggests an unusually strong rotation.
Market Breadth Concerns: While indexes may show modest declines, this heatmap reveals significant underlying weakness in large-cap tech names that have been market leaders, potentially signaling a shift in market leadership.
5-Day Sector Leaderboard

5-Day Individual Performance Grouped By Sector (Size By Market Cap)

ETF Insights
Reviewing a heatmap like this weekly can be incredibly helpful for investors as it provides a quick and visual summary of market performance across various sectors, asset classes, and geographies.
1. Sector and Asset Class Trends
Identify Strong and Weak Sectors: Investors can quickly spot which sectors (e.g., technology, energy, healthcare) are performing well or underperforming.
Asset Class Diversification: Seeing how commodities, fixed income, equities, and cryptocurrencies performed helps assess diversification.
2. Market Sentiment
Risk-On or Risk-Off: A green-dominated map suggests bullish sentiment, while red indicates bearish sentiment. Investors can align their strategies accordingly.
Volatility Indicators: Observing movements in volatility indices (e.g., VIX) can highlight changing market dynamics.
3. Regional Analysis
Global Insights: Performance in developed and emerging markets (e.g., Europe, China, Asia-Pacific) helps in gauging international investment opportunities or risks.
Currency Impacts: Movements in forex or country-specific ETFs can indicate currency-driven market trends.
4. Thematic Trends
Growth vs. Value: Comparing the performance of growth ETFs (e.g., VUG) versus value ETFs (e.g., VTV) reveals the prevailing market preference.
Industry Leadership: Highlighting leadership within industries (e.g., gold miners, semiconductors) can inform thematic plays.
5. Monitoring Investments
Portfolio Alignment: Investors can track how their existing investments or watchlist align with broader market trends.
Rotation Signals: Seeing week-over-week changes in sector dominance may signal sector rotation opportunities.
6. Risk Management
Recognizing Overbought/Oversold Conditions: Consistent underperformance or overperformance in specific areas may indicate potential mean-reversion trades.
Correlation Awareness: By observing how different asset classes move, investors can manage portfolio correlation and risk.
7. Decision Support
Identify Outperformers/Underperformers: ETFs, sectors, or indices that repeatedly outperform or underperform can help refine trading or investment strategies.
Macro Perspective: Weekly trends highlight macroeconomic or geopolitical influences affecting markets.
Regularly reviewing a heatmap like this is a strategic practice that supports data-driven decision-making while fostering a holistic understanding of market dynamics.

Technology sector is experiencing significant pressure, with major tech ETFs showing substantial losses:
SMH (Semiconductor ETF): -6.89%
XLK (Technology Select Sector): -3.98%
SOXX (iShares Semiconductor): -6.90%
SOXL (Leveraged Semiconductor): -21.10%
Fixed Income and Bonds are performing well, providing a safe haven:
TLT (Long-Term Treasury): +3.15%
IEF (7-10 Year Treasury): +1.72%
BND (Total Bond Market): +1.23%
AGG (Aggregate Bond): +1.25%
Financial sector shows resilience amid market volatility:
XLF (Financial Select Sector): +2.82%
SOxs (Direxion Financial Bull): +21.02%
KRE (Regional Banks): +1.06%
Real Estate and Utilities are performing relatively well:
VNQ (Vanguard Real Estate): +2.72%
IYR (iShares Real Estate): +2.22%
XLU (Utilities Select Sector): +1.31%
Commodity-related ETFs are broadly negative:
GLD (Gold): -2.76%
SLV (Silver): -4.93%
USO (Crude Oil): -13.07%
UNG (Natural Gas): -9.80%
Cryptocurrency ETFs show significant losses:
IBIT (Bitcoin ETF): -11.16%
FBTC (Fidelity Bitcoin): -11.24%
BITO (ProShares Bitcoin): -11.02%
Global and emerging markets are struggling:
EEM (Emerging Markets): -3.76%
EWZ (Brazil): -5.34%
YINN (China Bull 3X): -9.23%
FXI (China Large-Cap): -2.79%
Healthcare sector is outperforming technology:
XLV (Healthcare Select Sector): +1.71%
Inverse ETFs are positive, reflecting market declines:
SQQQ (Inverse NASDAQ): +10.41%
SDS (UltraShort S&P 500): +2.11%
Major index ETFs show modest losses:
SPY (S&P 500): -0.96%
QQQ (NASDAQ): -3.40%
IWM (Russell 2000): -1.65%
Global Overview
Foreign ADR stocks listed on NYSE, NASDAQ & AMEX categorized by geographic location. Reviewing a global heatmap like this weekly is valuable for investors because it offers insights into international markets, helping to:
Identify Global Trends: Spot which regions or countries are performing well or underperforming.
Assess Sector and Regional Performance: Understand how industries are faring across different regions.
Diversify Portfolios: Uncover opportunities in emerging or developed markets for greater diversification.
Gauge Global Sentiment: Recognize the impact of macroeconomic events on specific regions.
Align with Global Strategies: Refine investment strategies based on regional strengths or weaknesses.
This overview ensures investors stay informed about global opportunities and risks, complementing their domestic market analysis.

Asia, particularly Taiwan, is experiencing significant downward pressure, with TSM (Taiwan Semiconductor Manufacturing) showing a substantial decline of -8.93%. This is notable as TSM has a large market cap indicated by its box size.
The technology sector appears to be under pressure globally, with companies like ASML (-3.82%) in the Netherlands, and Chinese tech firms like BABA (Alibaba, -7.82%) and PDD (PinDuoDuo, -13.44%) showing significant losses.
There's a clear regional pattern in Europe, where companies are showing mixed but generally modest performance, with more balanced distribution between gains and losses.
Japan seems to be performing relatively better than China, with companies like SONY (+1.05%) and MUFG (+0.71%) in positive territory.
In South America, commodity-focused companies like VALE (-6.73%) in Brazil are showing notable declines.
The Australian market is dominated by BHP (-5.75%), suggesting resource stocks may be under pressure.
The financial sector shows mixed results across regions, with some banks like UBS (+2.43%) performing positively while others struggle.
The largest market cap losses appear concentrated in semiconductors and tech, particularly in Asia (TSM, ASML).
Green spots (positive performers) are more evenly distributed across regions but generally represent smaller market caps than some of the notable red boxes.
North American companies shown (Canadian and some US-listed ADRs) display mixed but somewhat more positive performance compared to Asian counterparts.
Want to keep reading? This VL weekly report on which names and sectors institutions are positioned in is only available to subscribers. You can follow me on Twitter/X for occasional free posts or you can sign-up today for real-time access to the only platform delivering critical context into institutional order flow without the wait 👇👇👇