Market Momentum: Your Weekly Financial Forecast & Market Prep
Issue 15 / What to expect Sept 30, 2024 thru Oct 4, 2024
Weekly Wrap-Up
Federal Reserve Easing Cycle
Recently, the Federal Reserve initiated its anticipated easing cycle with an unexpectedly large rate cut of 50 basis points (bps), surprising market participants who had anticipated a more typical 25 bps reduction. This bold move signaled the beginning of a new policy direction by the Fed, even as economic indicators, like the August retail sales report, remained strong. Historically, such outsized cuts have been used when the economy is on the brink of a downturn, characterized by a sharp decline in retail sales momentum, as seen in January 2001 and September 2007. However, in this instance, the strong economic backdrop did not fully align with the Fed's aggressive action.
Fed Chair Jerome Powell described the rate cut as a "recalibration" of monetary policy rather than an indication of future cuts, explaining that the aim was to ensure the economy's continued strength rather than to address any immediate weakness. Despite initial concerns from investors that this move might suggest hidden vulnerabilities in the economy, Powell's reassurances seemed to quell those fears. While future rate cuts are expected to be more gradual, as indicated by the Fed's dot plot, investors now face a shorter window to diversify out of cash, prompting a shift in market sentiment.
Stock Market Performance
The U.S. stock market has been on an upward trajectory, with last week marking the sixth weekly gain in the past seven weeks. Since early August, stocks have surged by 11%, demonstrating resilience despite the looming uncertainties surrounding the upcoming U.S. presidential election. This impressive performance underscores the market's focus on Federal Reserve policy rather than political concerns, which have not yet triggered significant volatility.
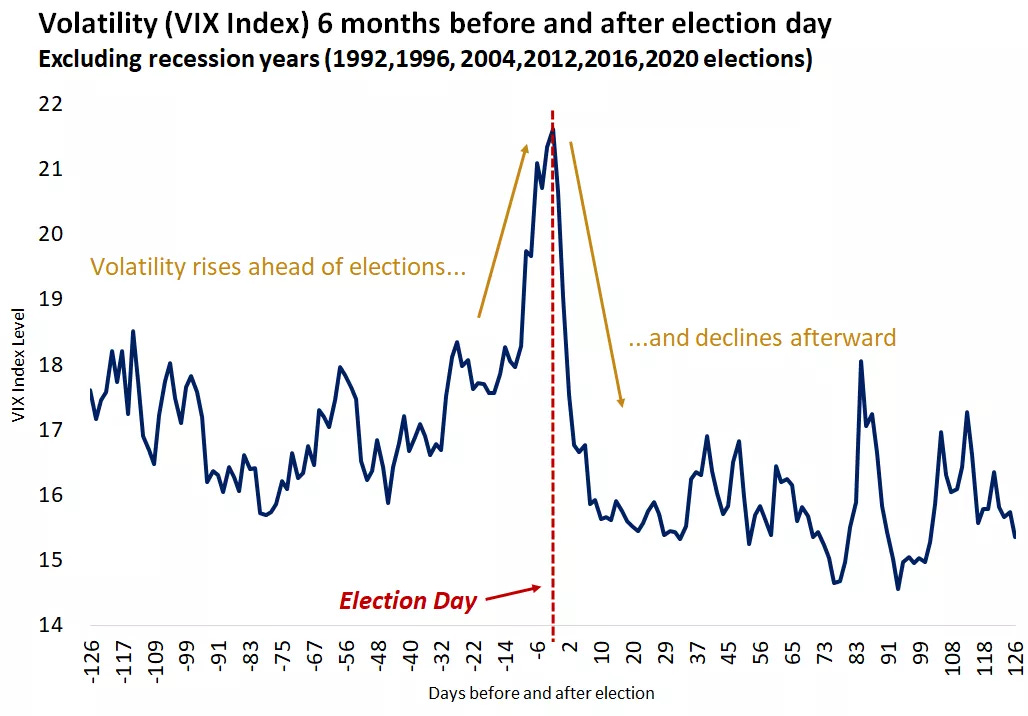
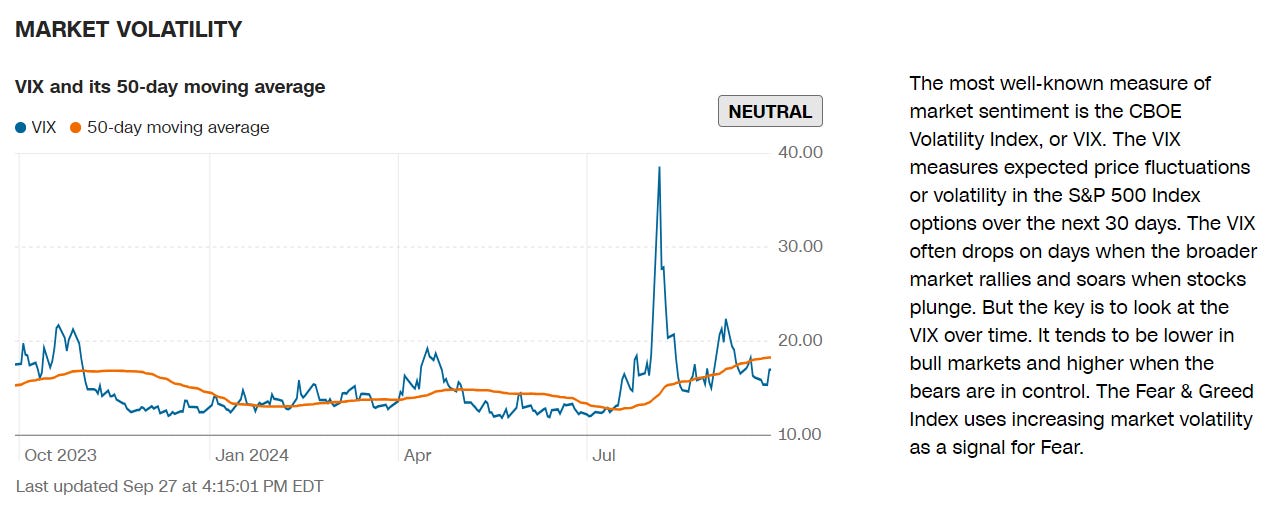
As the U.S. approaches election day, markets are expected to experience volatility, but this is likely to be short-lived. Historically, market turbulence surrounding elections is driven by the repricing of potential new policy proposals rather than a fundamental reaction to the election outcome. Market volatility has typically subsided once a clearer policy direction emerges, regardless of which political party assumes power. For instance, after the 2000 election, marked by the "hanging chad" controversy, volatility persisted until the Supreme Court resolved the outcome in mid-December. However, following the resolution, volatility, as measured by the Cboe Volatility Index (VIX), declined substantially.
Post-Election Market Trends
Looking at historical data, the U.S. stock market has generally performed well in the aftermath of presidential elections. In the month leading up to elections, the stock market has been positive in just over half of the years. However, the period from election day through year-end has been overwhelmingly positive, with only three instances of declines in the past 80 years. Notably, the largest post-election gains were recorded in 2020, 1952, 1960, and 1980, with strong performance seen under both Republican and Democratic presidencies. This reflects the idea that broader economic conditions, rather than political outcomes, are the primary drivers of long-term market performance.
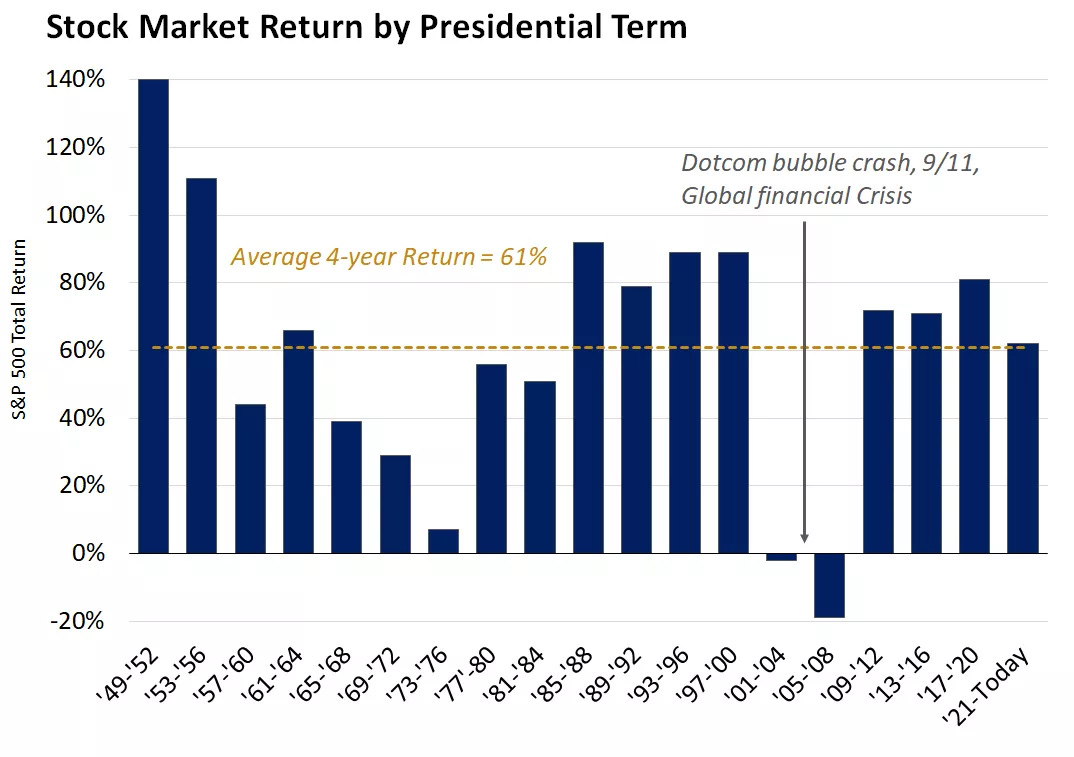
In the week following an election, stock market performance has been mixed, with an average decline of 1%. However, over the longer term, the market has rebounded, with an average gain of over 10% in the year following an election. Over a full presidential term, the stock market has gained an average of 61%, with only two periods of decline—following the 2004 and 2000 elections. The key takeaway is that market performance over an election cycle is shaped more by broader economic trends than by the election outcome itself.
Economic Indicators
Several key economic indicators have provided a positive backdrop for the financial markets:
Easing Inflation: The U.S. Federal Reserve's preferred inflation gauge, the Personal Consumption Expenditures (PCE) Index, showed further signs of easing in August. The index rose at an annual rate of 2.2%, slightly below expectations and marking the lowest reading since February 2021. Core inflation, which excludes volatile food and energy prices, also came in as expected at 2.7%. These figures suggest that inflationary pressures are gradually cooling, giving the Fed more confidence to continue its easing policy.
GDP Growth: The U.S. economy grew at an annual rate of 3.0% in the second quarter of the year, according to the government's latest estimate. This figure matched earlier estimates and exceeded economists' expectations, signaling that the economy remains robust despite concerns of a slowdown.
Unemployment: Weekly unemployment claims fell to 218,000, the lowest level in four months, further indicating a healthy labor market. A stronger labor market supports consumer spending, which is a critical driver of economic growth.
Consumer Sentiment: The University of Michigan's Consumer Sentiment Index rose to 70.1 in September, up from 67.9 in August. This marks the second consecutive monthly increase, reversing a recent downward trend and suggesting that consumers remain optimistic about the economic outlook.
Global Factors
The global economic landscape also played a role in market dynamics:
China Stimulus: Mainland Chinese stocks surged following the announcement of new stimulus measures by the People's Bank of China (PBOC). These measures include lowering borrowing costs, injecting liquidity into the economy, and easing mortgage repayment burdens for households. This stimulus is aimed at boosting growth in the world's second-largest economy, which has recently shown signs of sluggishness.
European Stock Gains: European stocks also performed well, with a key index rising by over 2% for the week. This gain was driven by better-than-expected inflation data from France and Spain, as well as optimism surrounding China's economic stimulus. Stocks in sectors such as chemicals and automobiles, which are sensitive to economic growth, were among the top performers.
Commodities and Oil Market
Oil prices have been on a downward trend, with U.S. crude oil falling nearly 4% for the week to under $69 per barrel. This represents a significant decline from the recent high of $84 per barrel in early July. The drop in oil prices can be attributed to a combination of easing demand and concerns about global economic growth. Despite this, the oil market remains relatively stable, with little change in prices year to date.
Market Outlook
As the markets head into October, investors are preparing for potential volatility, especially in light of upcoming economic data releases such as the nonfarm payrolls report and the ISM Manufacturing PMI. Both of these reports contributed to market sell-offs in early August and September, respectively, and could have a similar impact if they fall short of expectations.
Despite these risks, the overall market sentiment remains positive. The Federal Reserve's rate cuts, coupled with strong economic data and easing inflation, provide a supportive environment for continued market gains. However, the upcoming U.S. presidential election introduces an additional layer of uncertainty, and investors should brace for potential short-term volatility.
Last Week At A Glance
Week-Over-Week Snapshots
Volatility
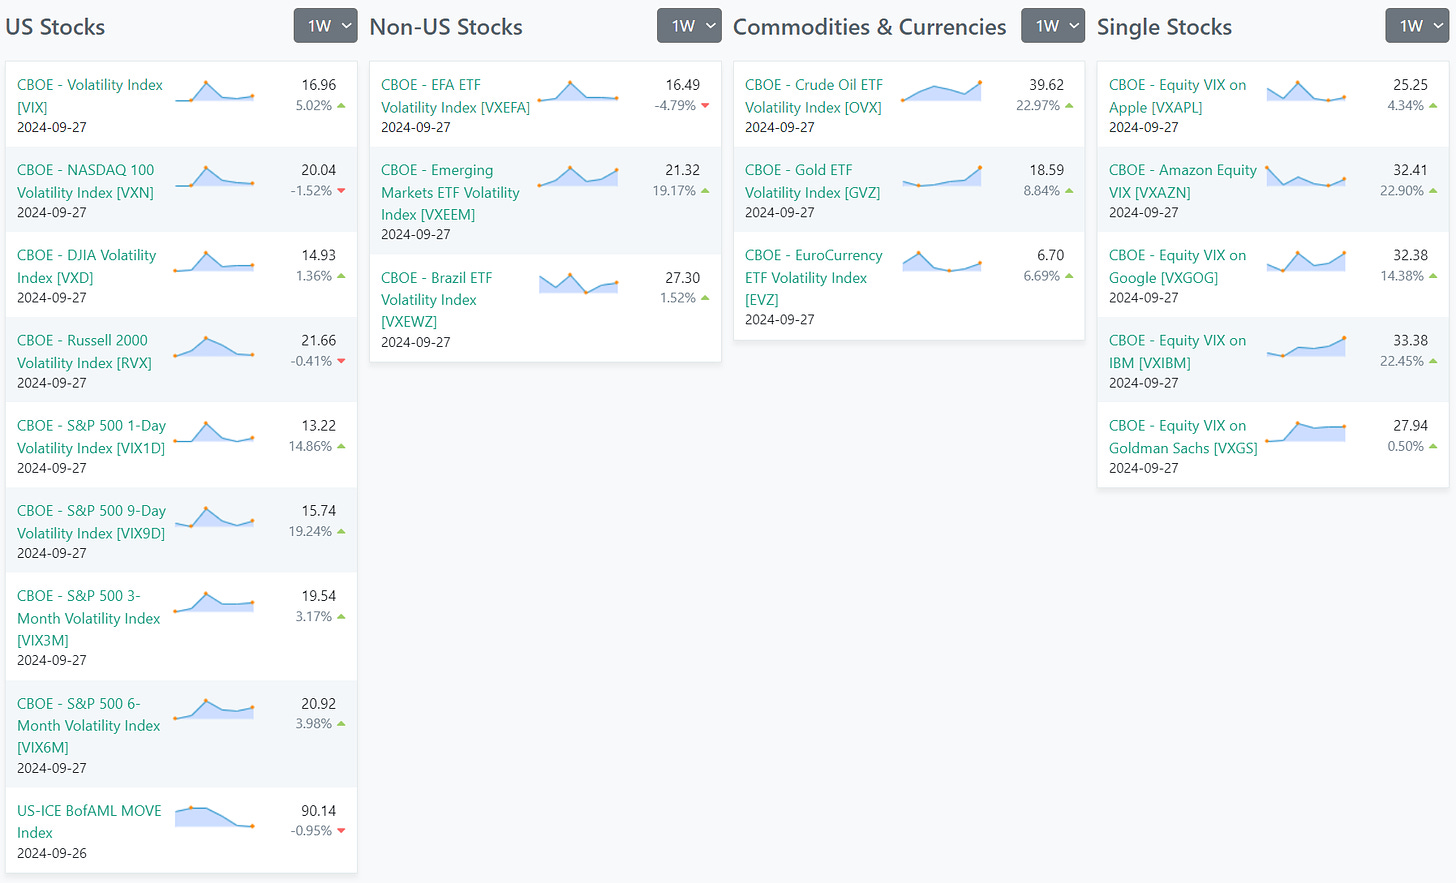
In US stocks, the CBOE Volatility Index (VIX) shows an appreciable uptick, hinting at heightened expected volatility in the S&P 500. This trend of increased volatility is reflected across other indices such as NASDAQ 100 and DJIA, albeit with variations in the percentage changes. Non-US stocks, represented by ETFs like the EFA ETF and Emerging Markets ETF, also broadly exhibit changes in volatility, with the Emerging Markets ETF Volatility Index notably rising by 19.17%. In the commodities and currencies sectors, there is a marked rise in volatility for crude oil and gold, with crude oil ETF volatility surging by 22.97%. Currency volatility, illustrated by the EuroCurrency ETF, has risen as well. Additionally, volatility indices for individual stocks like Apple, Amazon, Google, IBM, and Goldman Sachs vary, with Amazon's volatility increasing by 22.9%. This data collectively points to a general increase in market volatility across various sectors and geographies.
ETFs
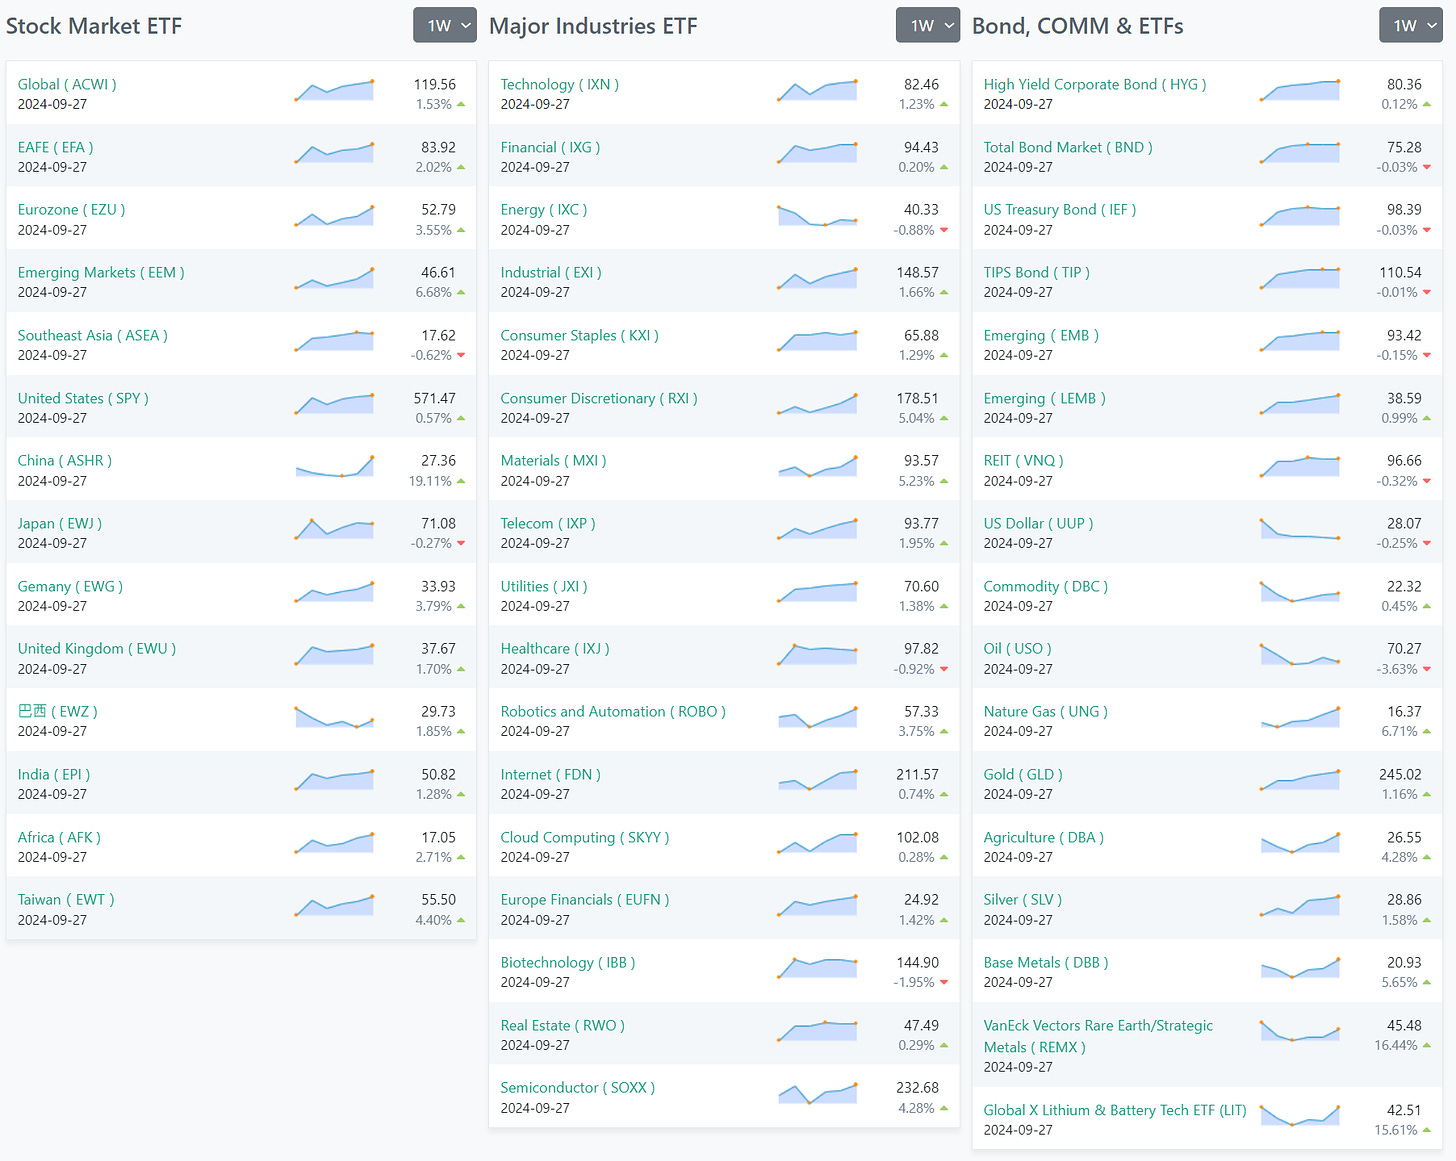
In the Stock Market ETF category, there's notable growth in regions like China (ASHR) which surged by 19.11%, and Southeast Asia (ASEA) which showed a decline of 0.62%. The United States (SPY) also exhibited a moderate increase. Among Major Industries ETFs, Technology (IXN) and Materials (MXI) sectors demonstrated notable gains, emphasizing a robust performance in these industries.
Conversely, in the Bonds, Commodities, and other ETFs section, while traditional safe-haven assets like US Treasury Bonds showed slight declines, the Natural Gas (UNG) ETF rose by 6.71%, and the Global X Lithium & Battery Tech ETF (LIT) increased significantly by 15.61%. This suggests a growing investor interest in energy and technology-focused commodities.
Overall, the snapshot indicates a mixed but dynamic market landscape with significant movements in technology and commodities sectors, alongside varied performances across global markets.
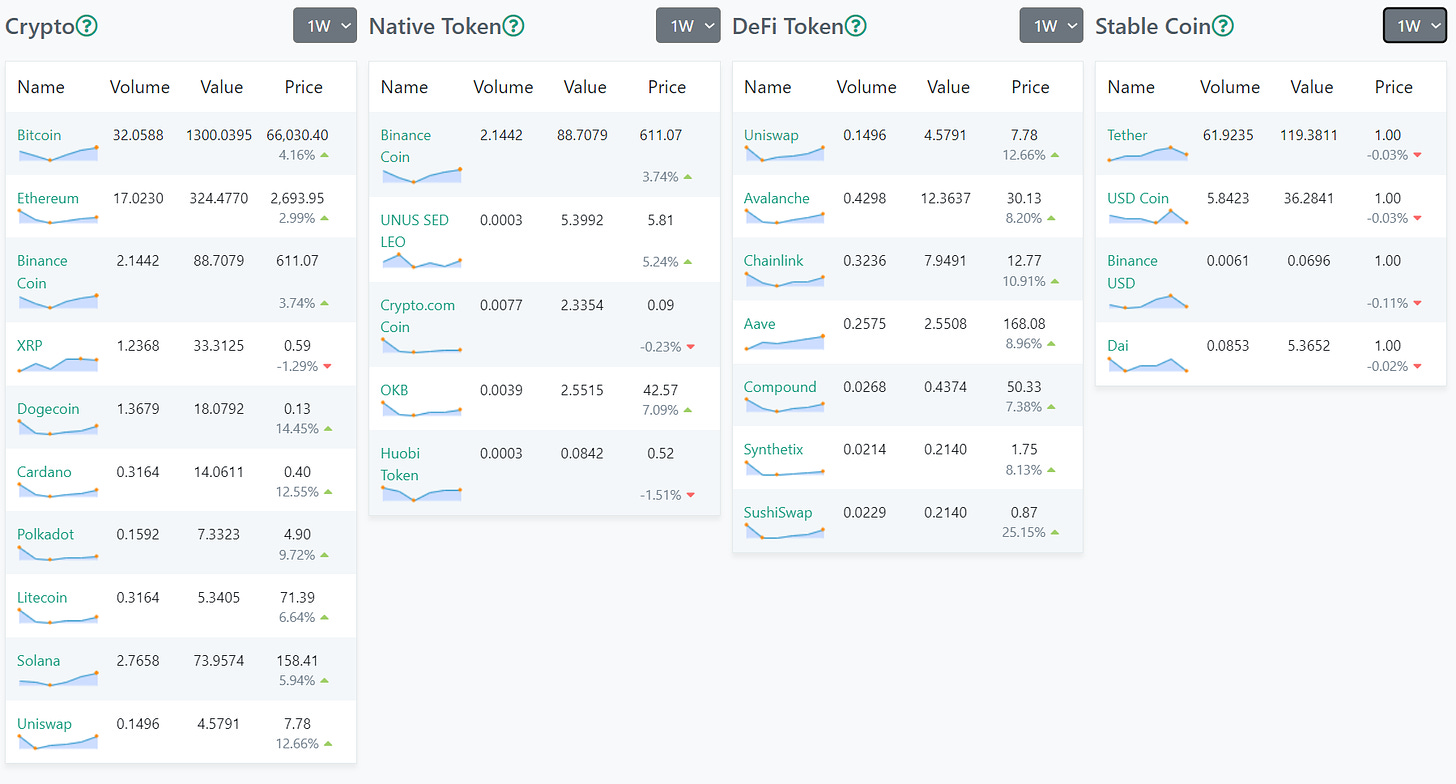
Crypto
Forex
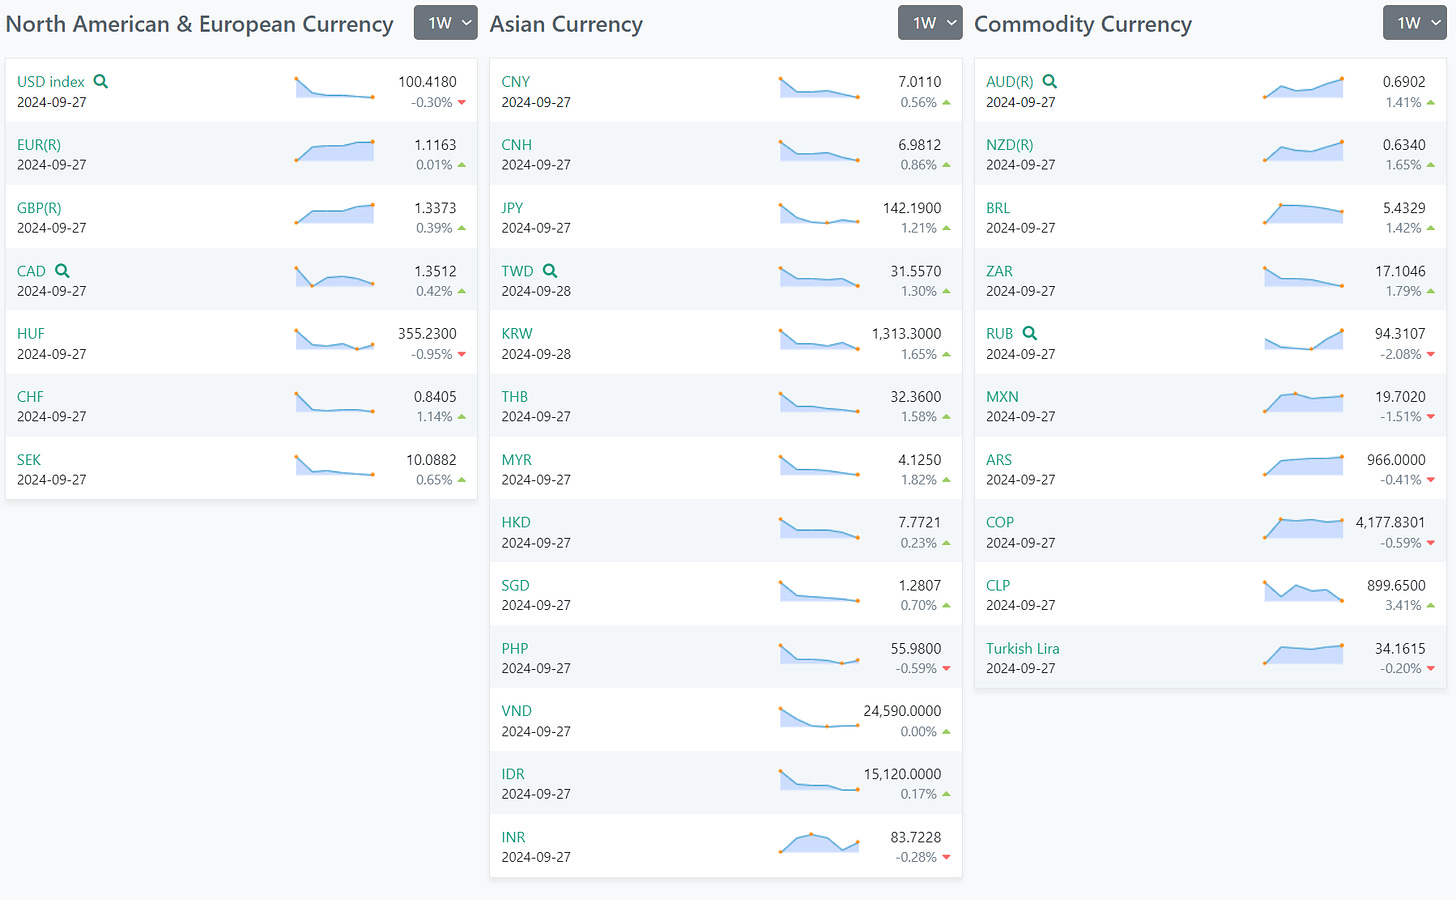
Notably, the USD Index has declined by 3.0%, suggesting a weakening of the US dollar against a basket of other currencies. This decline is contrasted by gains in several European currencies such as the Swiss Franc (CHF) and the British Pound (GBP), which have increased by 1.14% and 0.39% respectively.
In the Asian Currency category, there are noteworthy increases in the Japanese Yen (JPY) and the Korean Won (KRW), while the Chinese Yuan (CNY) shows a modest rise. This could indicate stronger economic outlooks or market reactions in these regions.
The Commodity Currency group shows a mixed performance with the New Zealand Dollar (NZD) appreciating significantly by 1.65%, whereas the Russian Ruble (RUB) has seen a notable decline of 2.08%. Such movements can sometimes reflect changes in commodity prices, given these currencies often correlate with national export commodities.
Historically, forex market movements are often aligned with broader economic indicators and market sentiment. The weakening of the US dollar could suggest investor anticipation of less favorable economic conditions or policy shifts in the US. Similarly, the strength seen in currencies like the NZD could be tied to positive commodity market trends.
US Investor Sentiment
%Bull-Bear Spread
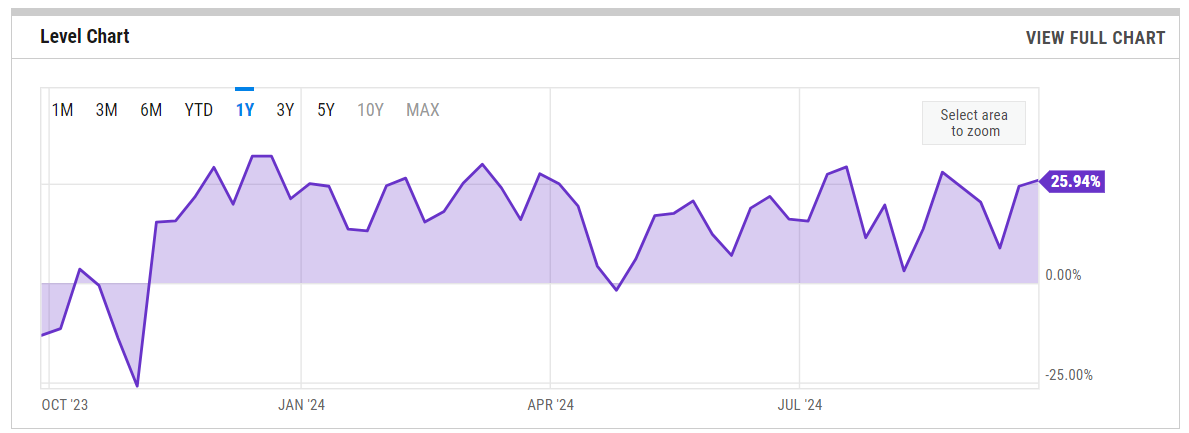
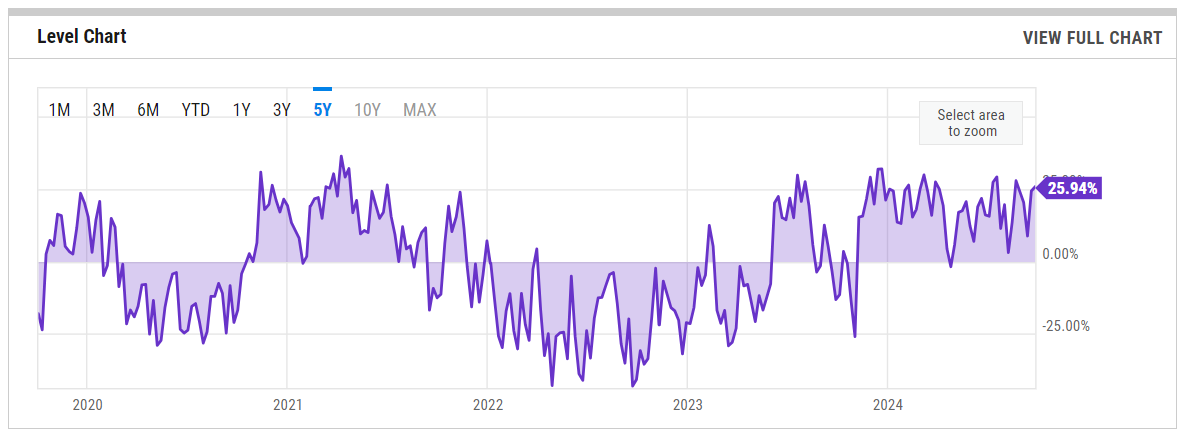
% Bull-Bear Spread is at 25.94%, compared to 24.42% last week and -3.31% last year. This is higher than the long-term average of 6.71%
1-Year View
5-Year View
NAAIM Exposure Index
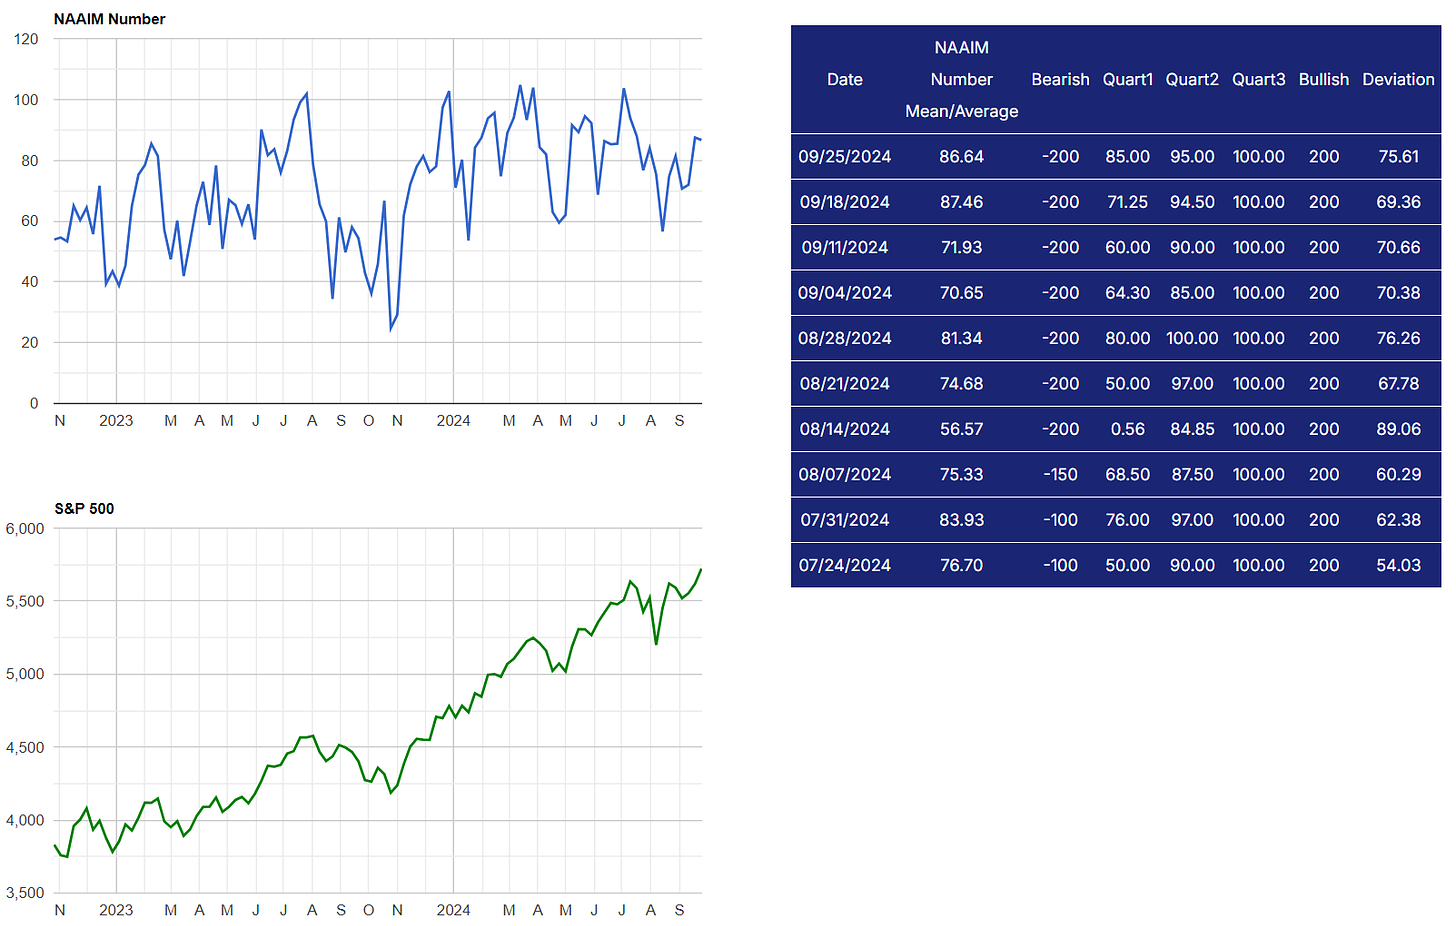
The NAAIM Exposure Index (National Association of Active Investment Managers Exposure Index) measures the average exposure to U.S. equity markets as reported by its member firms. These are typically active money managers who provide their equity exposure levels weekly. The index offers insight into how much these managers are investing in equities at any given time, ranging from being fully short (-100%) to leveraged long (up to +200%).
AAII Investor Sentiment Survey
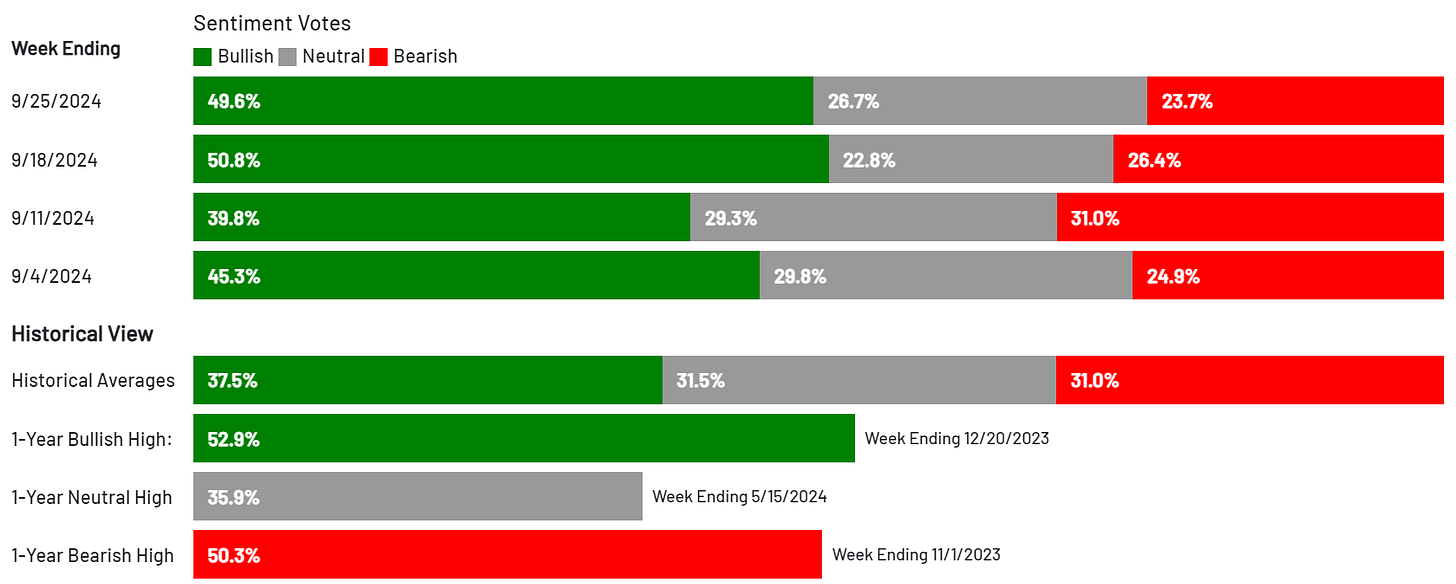
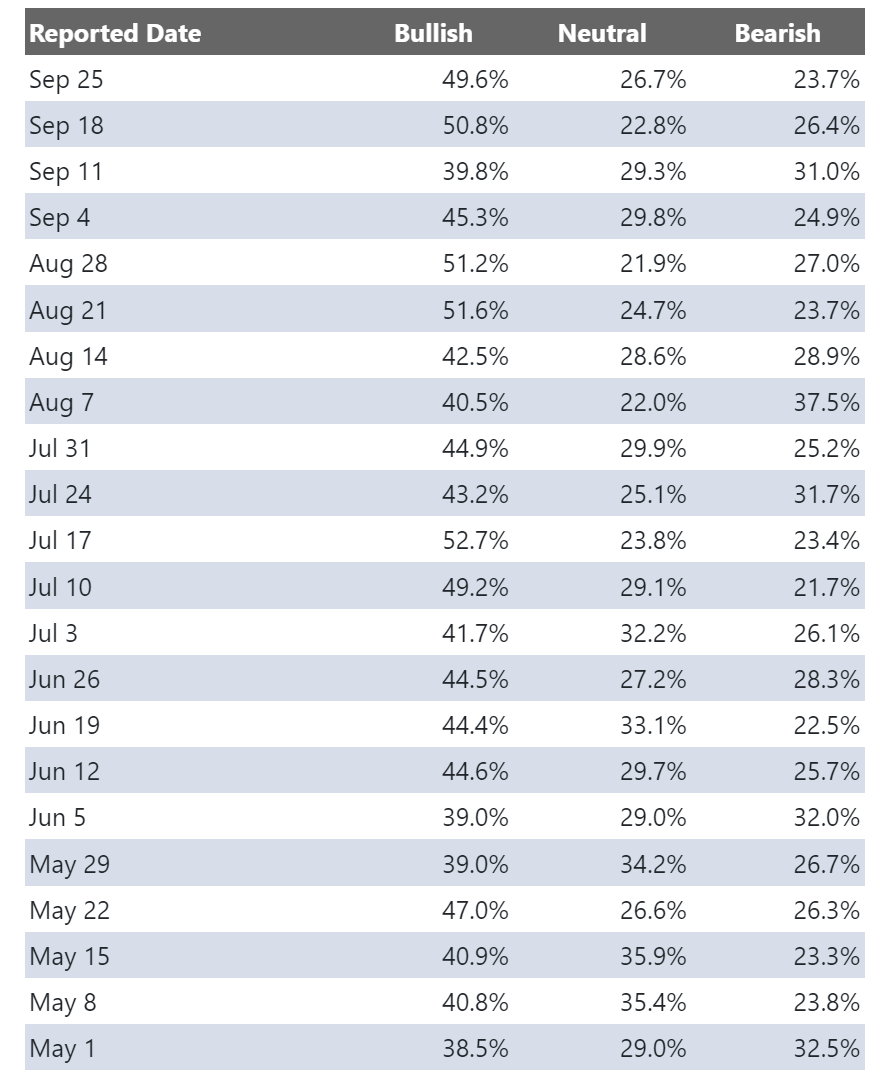
The AAII Investor Sentiment Survey is a weekly survey conducted by the American Association of Individual Investors (AAII) to gauge the mood of individual investors regarding the direction of the stock market over the next six months. It provides insights into whether investors are feeling bullish (expecting the market to rise), bearish (expecting the market to fall), or neutral (expecting the market to stay about the same).
Key Points:
Bullish Sentiment: Reflects the percentage of investors who believe the stock market will rise in the next six months.
Bearish Sentiment: Represents those who expect a decline.
Neutral Sentiment: Reflects investors who anticipate little to no market movement.
The survey is widely followed as a contrarian indicator, meaning that extreme levels of bullishness or bearishness can sometimes signal market turning points. For example, when a large number of investors are overly optimistic (high bullish sentiment), it could suggest a market top, while excessive pessimism (high bearish sentiment) may indicate a market bottom is near.
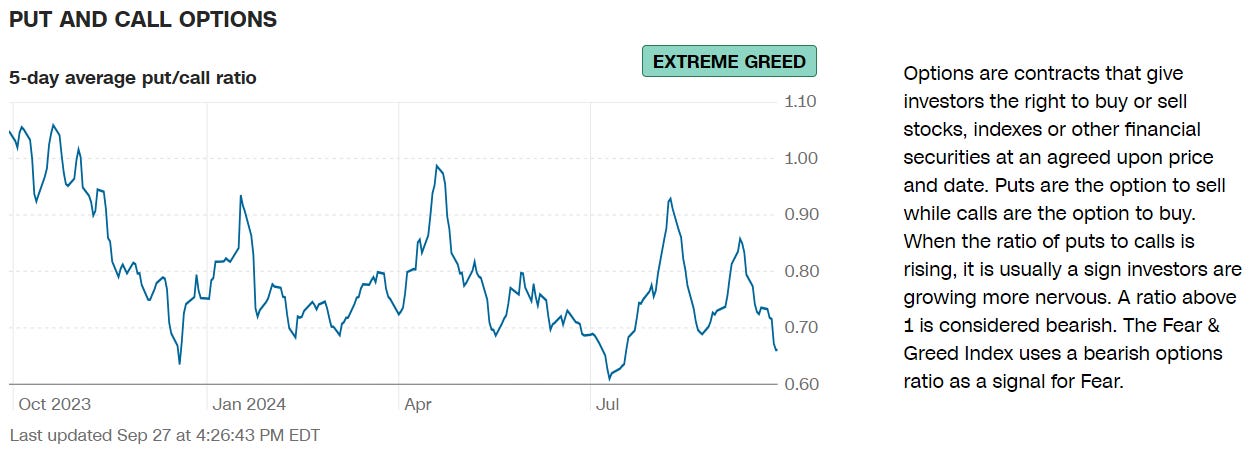
SPX Put/Call Ratio
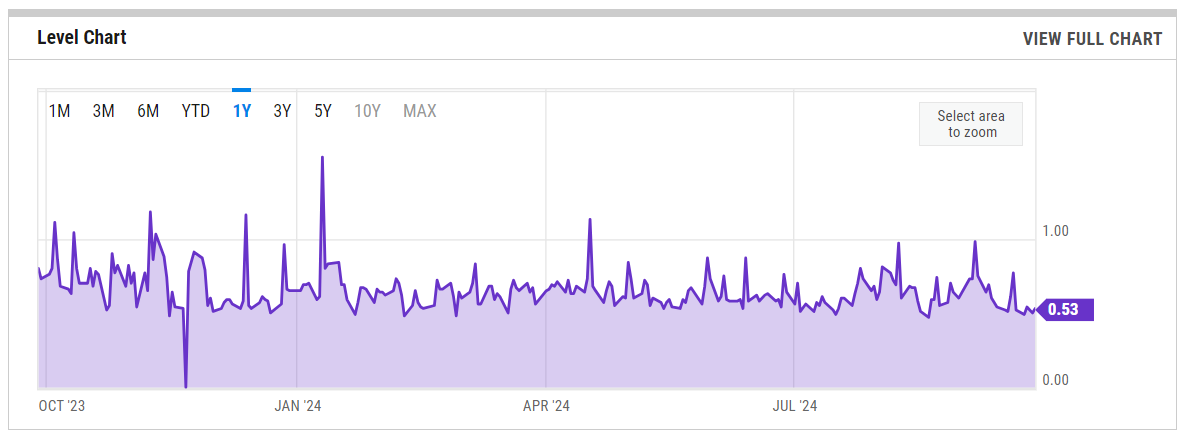
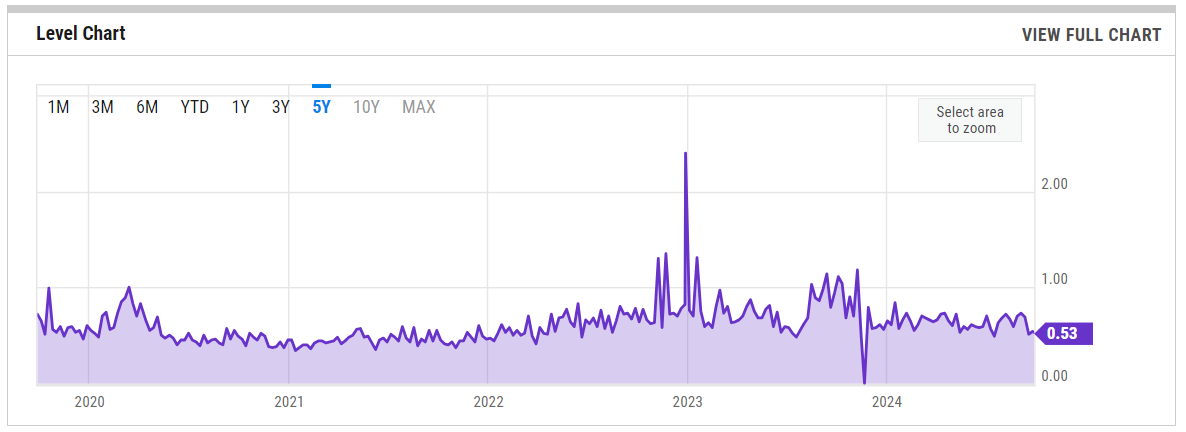
The SPX Put/Call Ratio is an indicator that is used to gauge market sentiment. This is calculated as the ratio between trading S&P 500 put options and S&P call options. A high put/call ratio can indicate fear in the markets, while a low ratio indicates confidence. For example, in 2015, the Put-Call ratio was as high as 3.77 because of market fears stemming from various global economic issues like a GDP growth slowdown in China and a Greek debt default.
1-Year View
5-Year View
CBOE Equity Put/Call Ratio
1-Year View
5-Year View
ISEE Sentiment Index
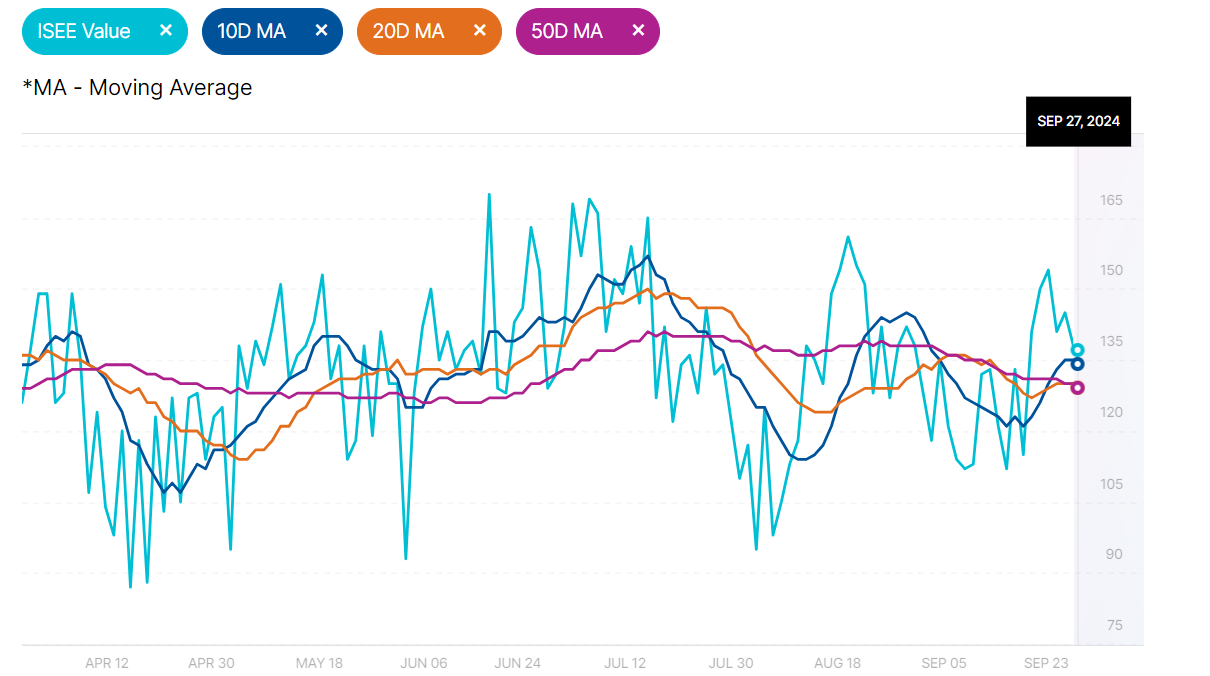
The ISEE (International Securities Exchange Sentiment) Index is a measure of investor sentiment derived from options trading. Unlike traditional put/call ratios, the ISEE Index focuses only on opening long customer transactions and is adjusted to remove market-maker and firm trades, providing a purer sentiment reading.
The ISEE Index typically ranges from 0 to 200, with readings above 100 indicating more call options being bought relative to put options, suggesting bullish sentiment. Conversely, readings below 100 suggest bearish sentiment, with more puts being purchased relative to calls.
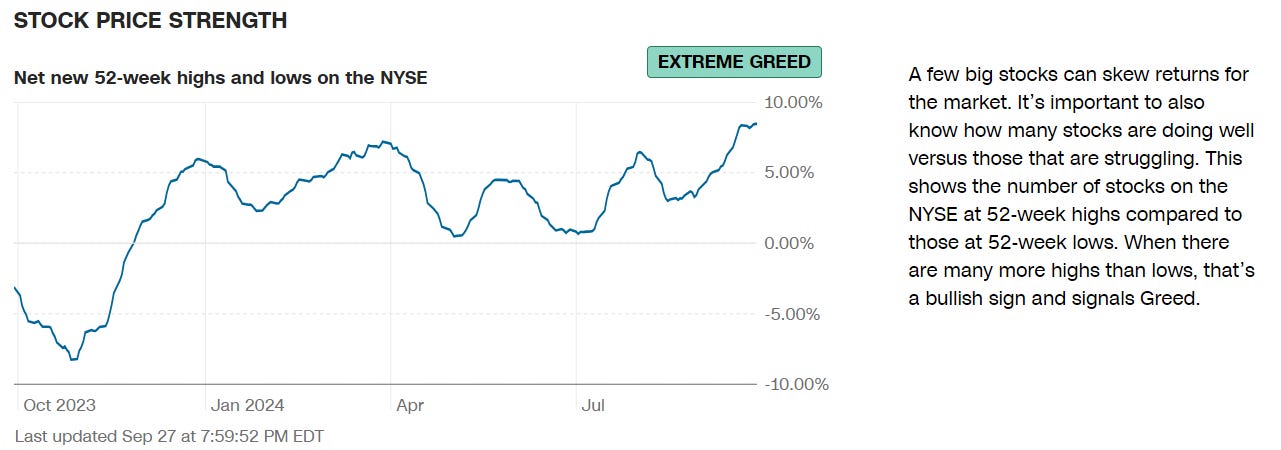
New Highs - New Lows
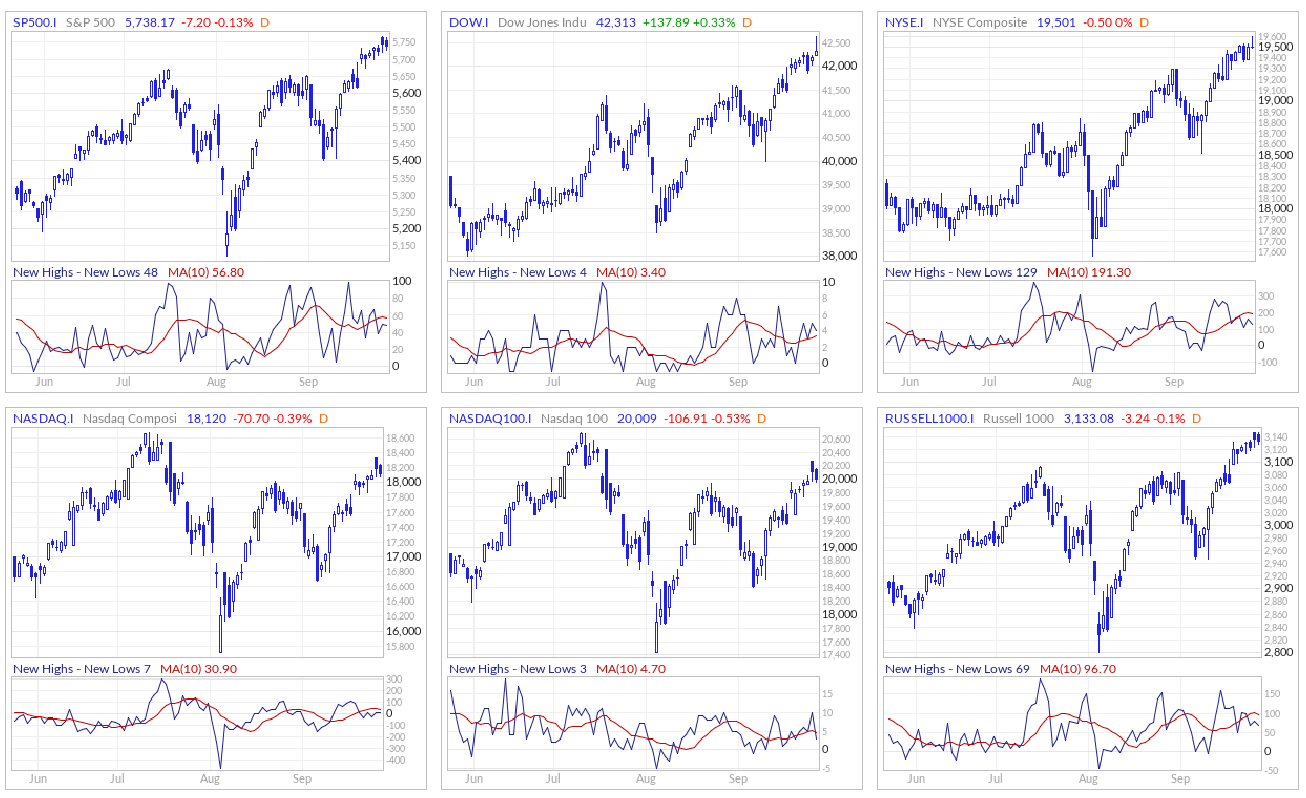
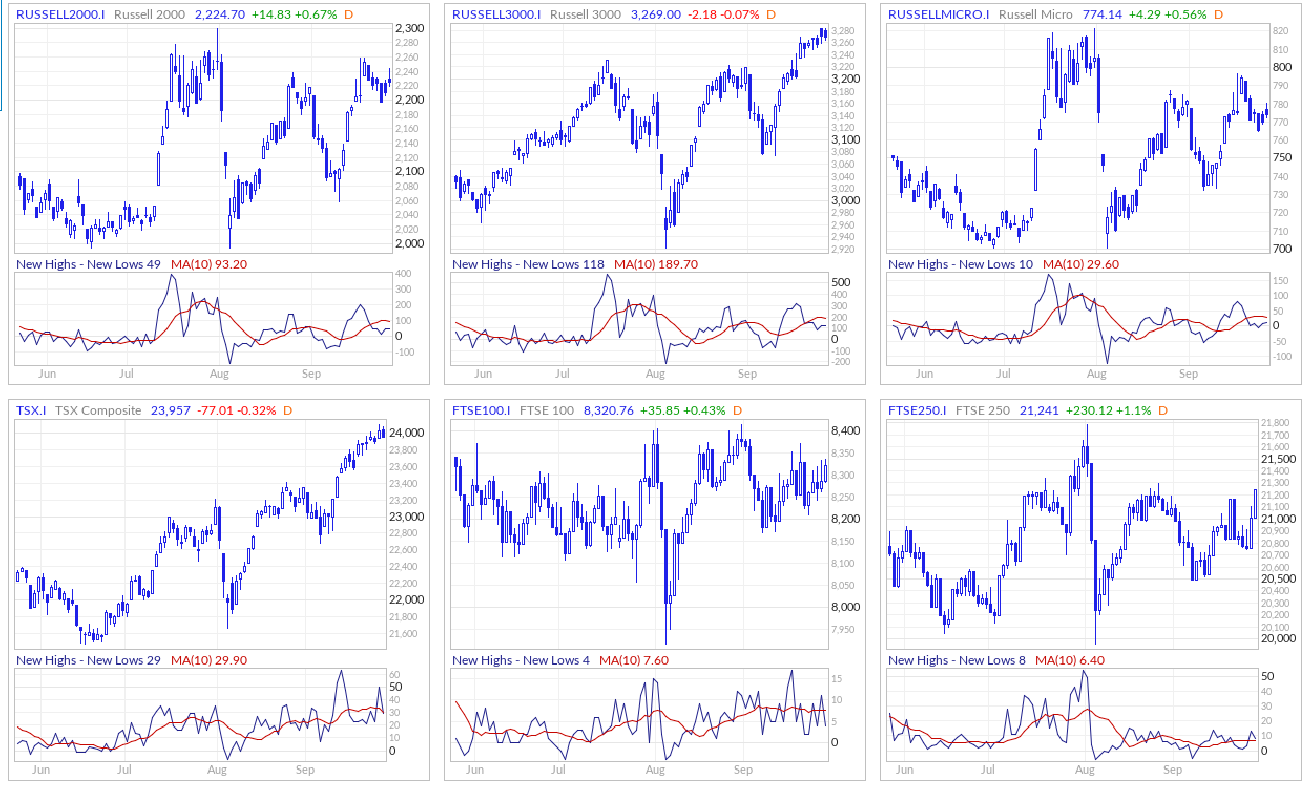
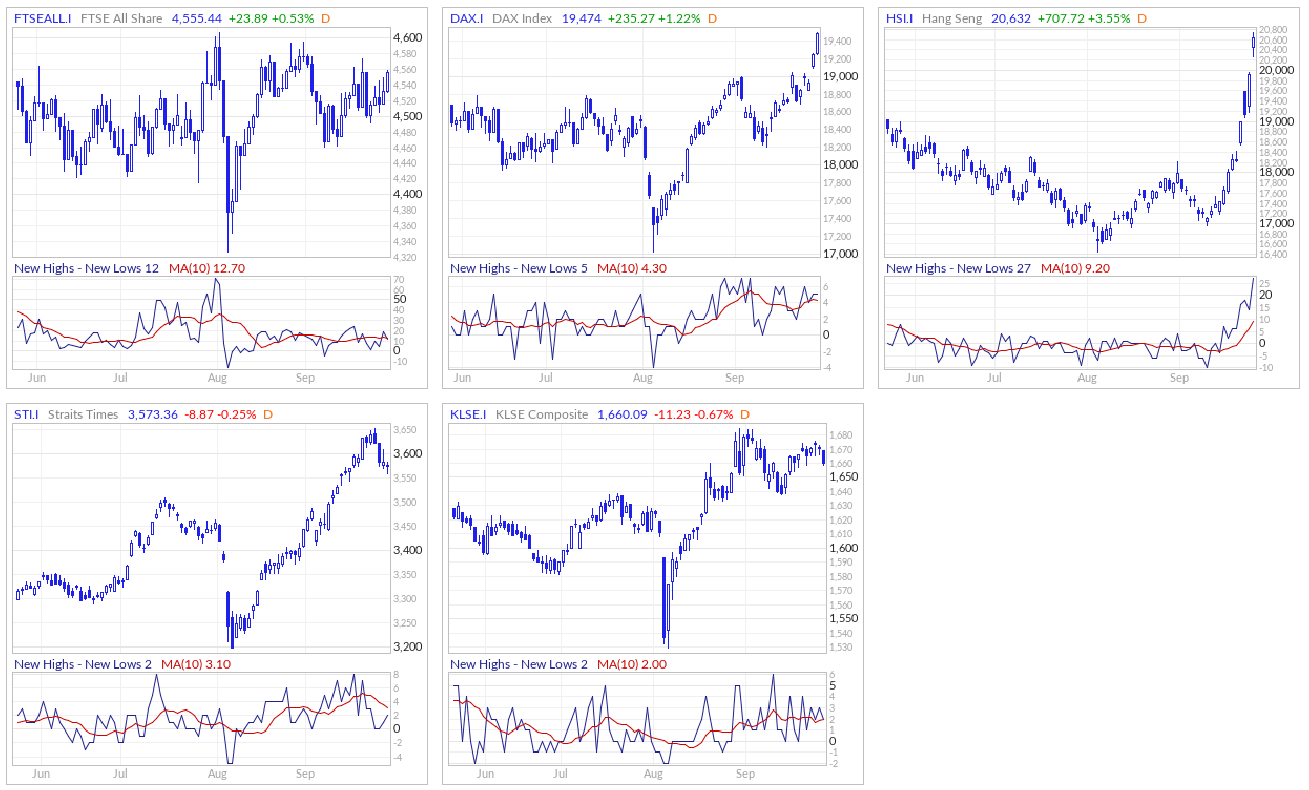
The New Highs - New Lows indicator (NH-NL) displays the daily difference between the number of stocks reaching new 52-week highs and the number of stocks reaching new 52-week lows. The NH-NL indicator generally reaches its extreme lows slightly before a major market bottom. As the market then turns up from the major bottom, the indicator jumps up rapidly. During this period, many new stocks are making new highs because it's easy to make a new high when prices have been depressed for a long time. The NH-NL indicator oscillates around zero. If the indicator is positive, the bulls are in control. If it is negative, the bears are in control. As the cycle matures, a divergence often occurs as fewer and fewer stocks are making new highs (the indicator falls), yet the market indices continue to reach new highs. This is a classic bearish divergence that indicates that the current upward trend is weak and may reverse.
ARMS Index
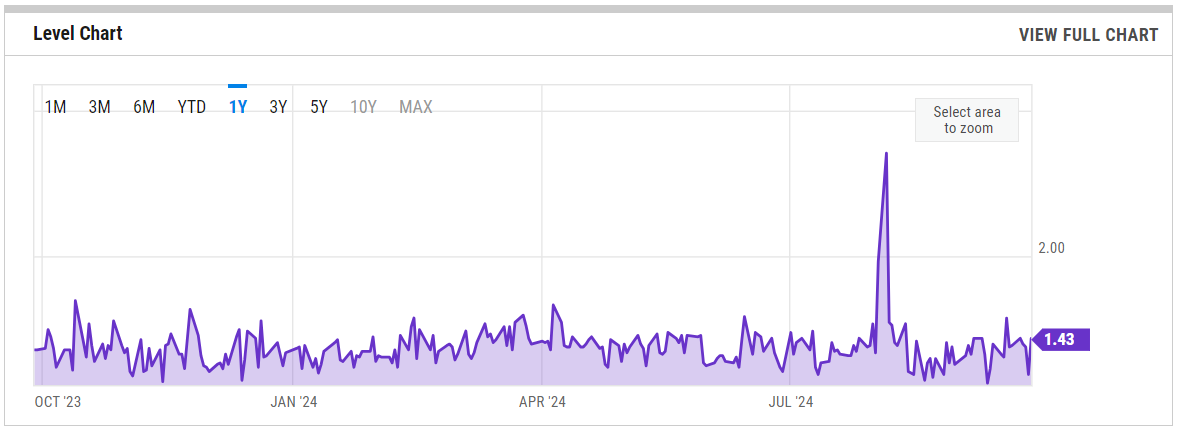
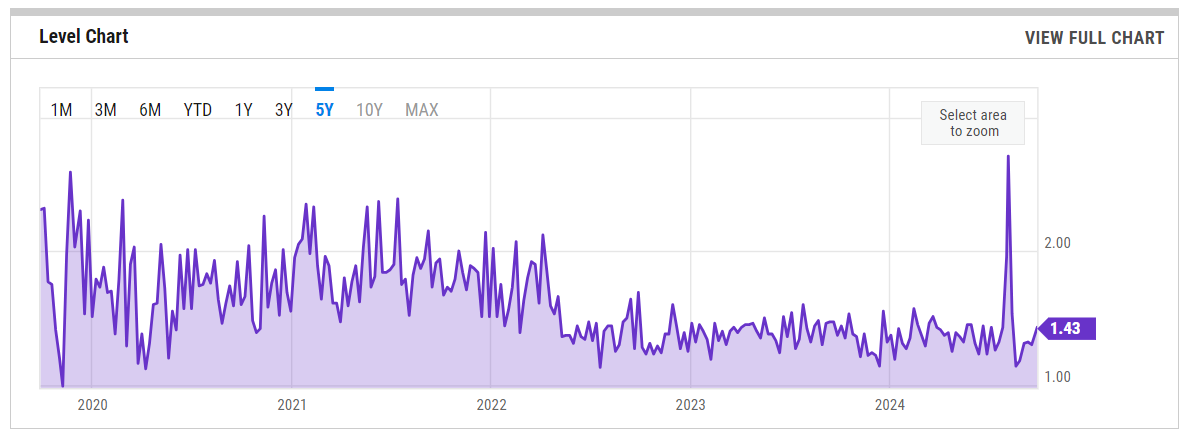
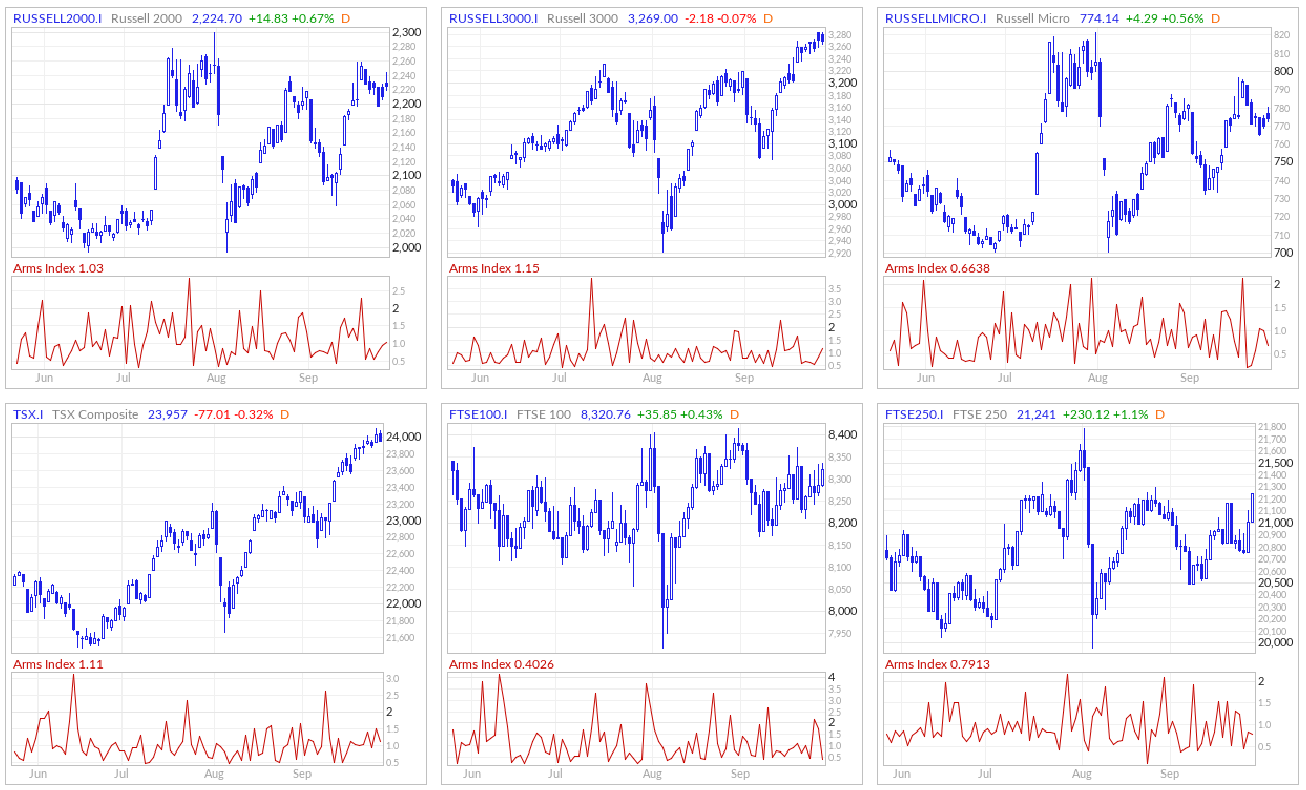
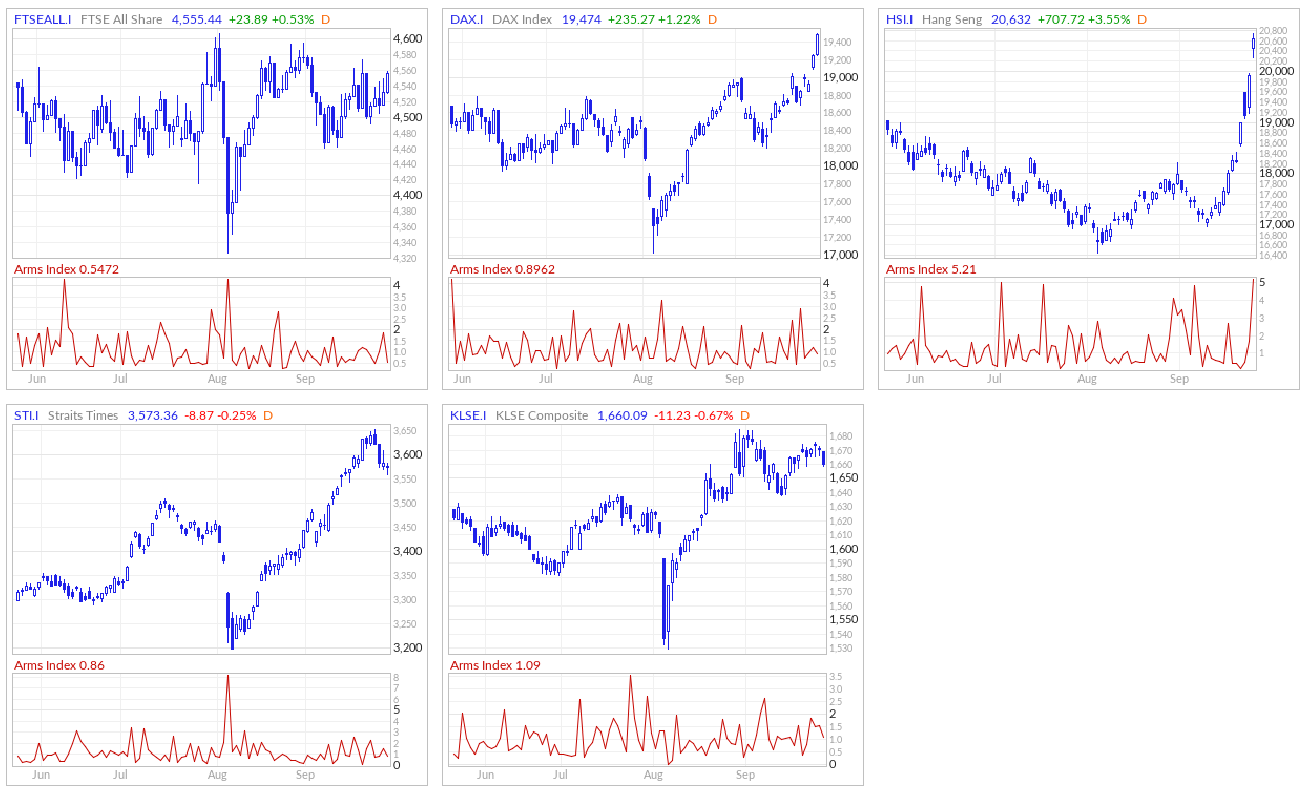
The Arms Index, also known as the TRIN (Short-Term TRading INdex), was developed by Richard Arms in the 1960s. It is calculated by dividing the ratio of advancing stocks to declining stocks by the ratio of advancing volume to declining volume. Interpreting the Arms Index involves looking at its value in relation to certain thresholds. A value below "1" is considered bullish, indicating that advancing stocks and volume dominate the market. Conversely, a value above "1" is considered bearish, suggesting that declining stocks and volume are more prevalent. Extremely low values (below 0.5) or high values (above 2) are often seen as potential reversal signals.
CME Fedwatch
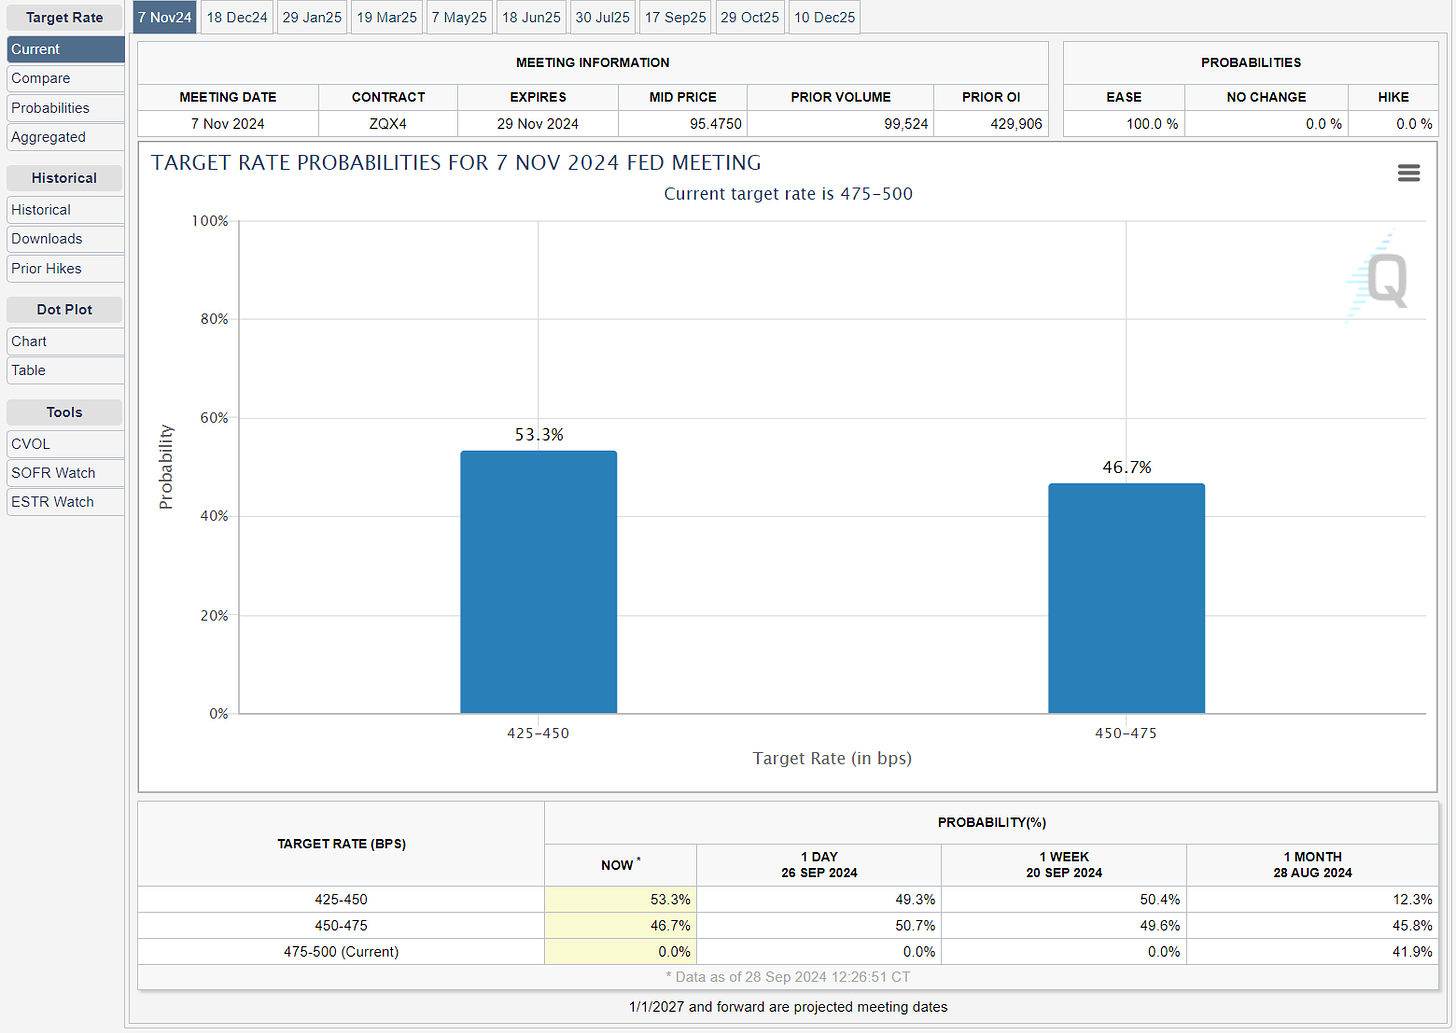
What is the likelihood that the Fed will change the Federal target rate at upcoming FOMC meetings, according to interest rate traders? Use CME FedWatch to track the probabilities of changes to the Fed rate, as implied by 30-Day Fed Funds futures prices.
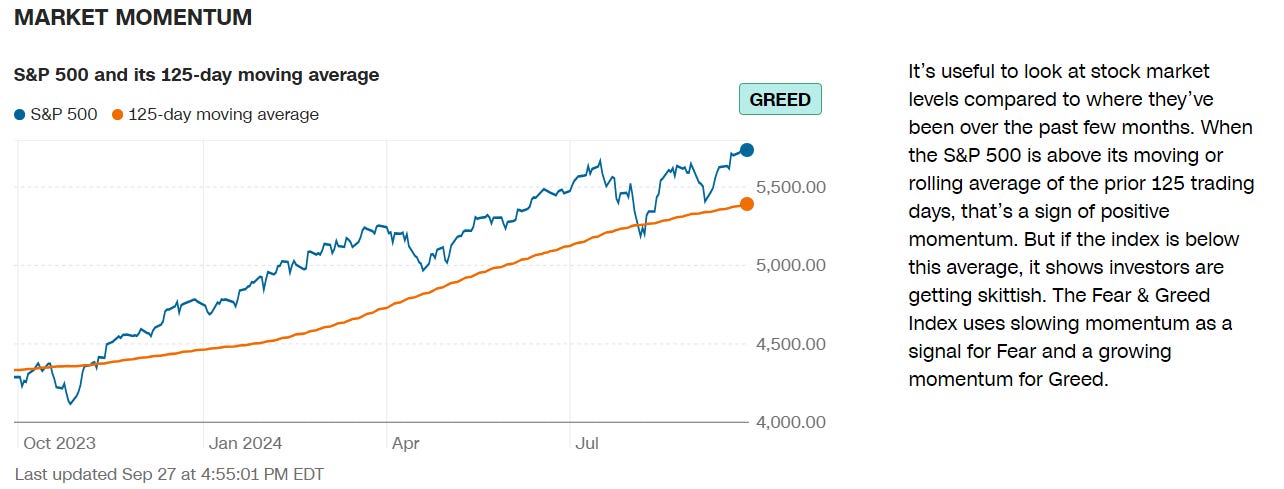
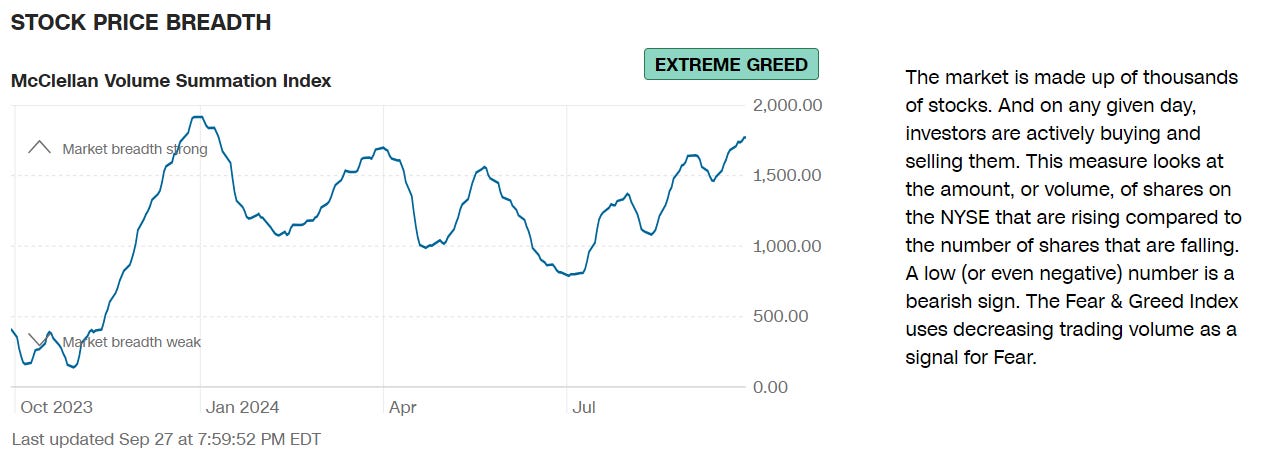
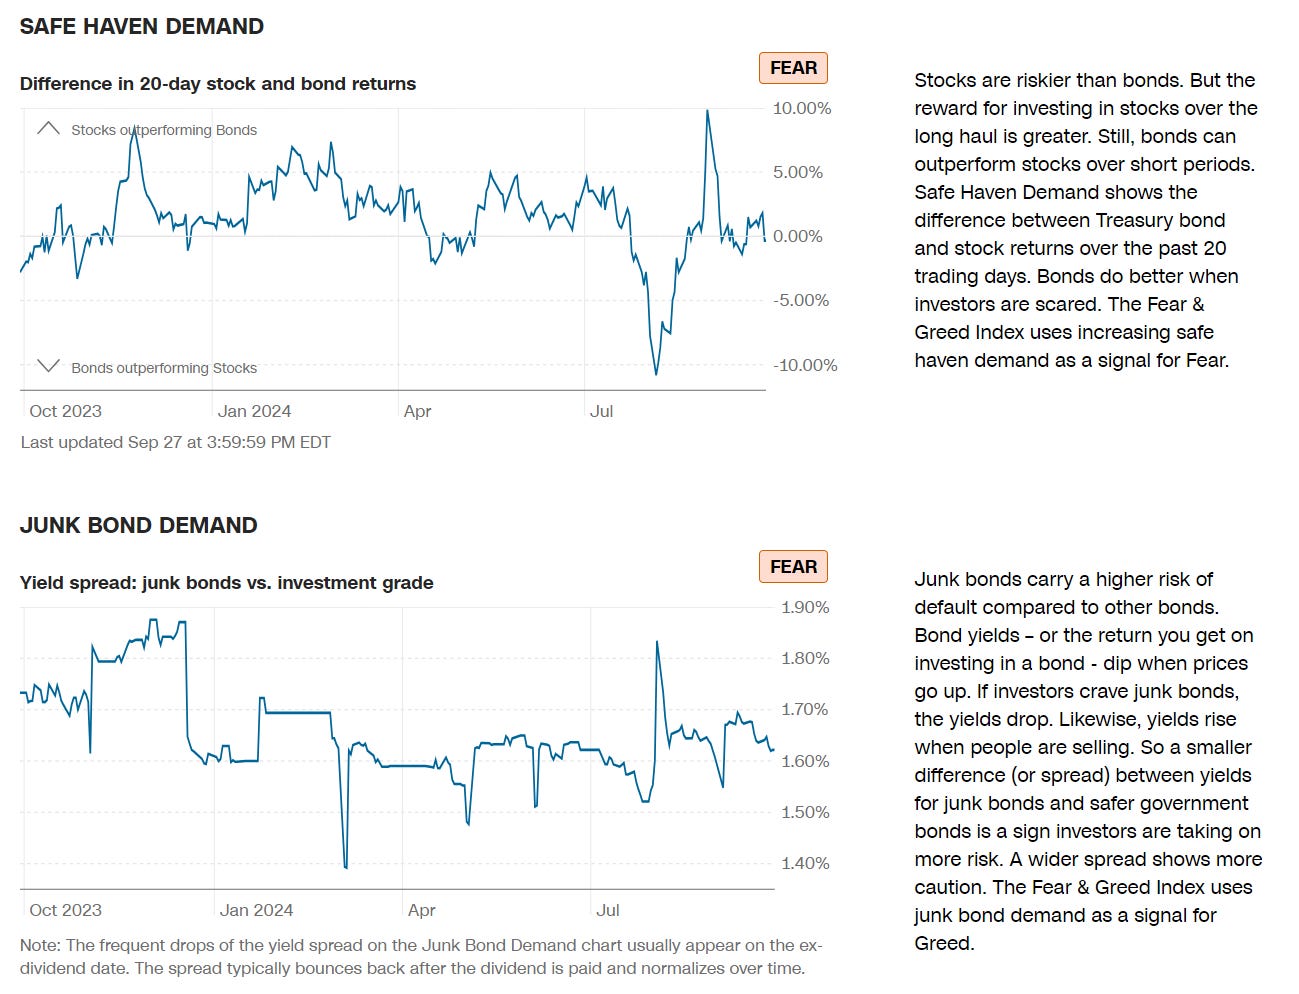
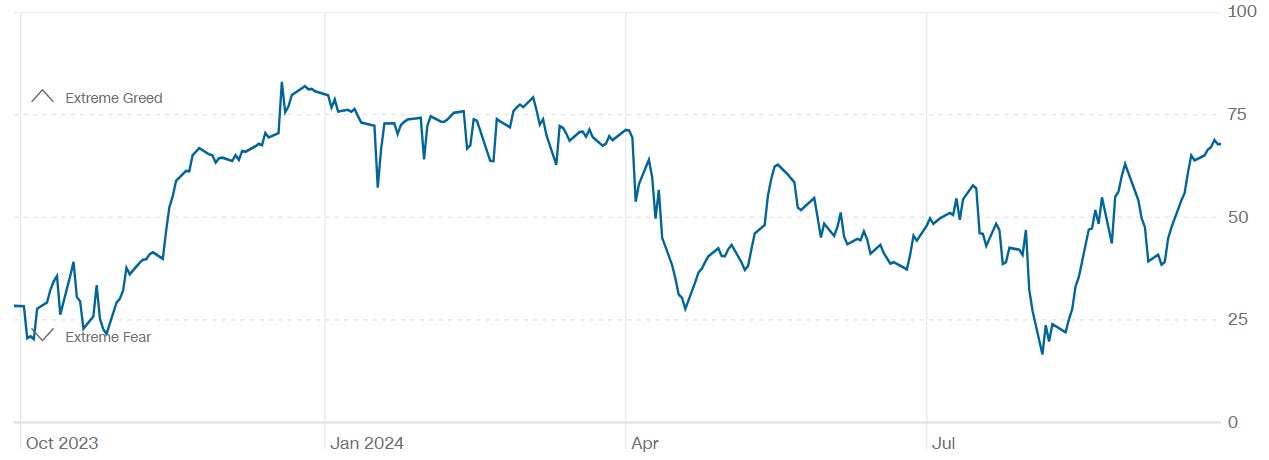
CNN 7 Fear & Greed Constituent Data Points + Composite Index
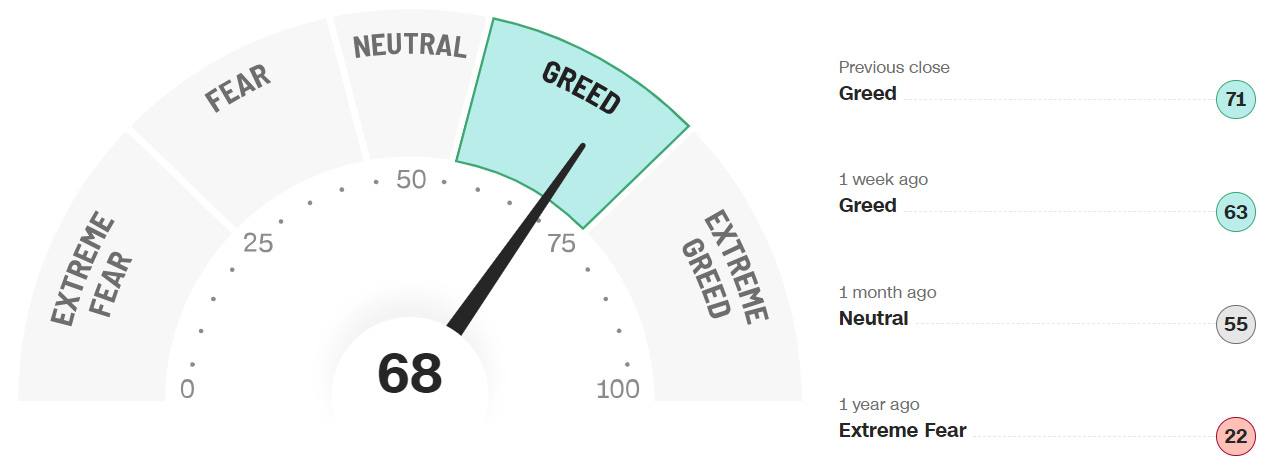
Final Composite Fear & Greed Index Reading
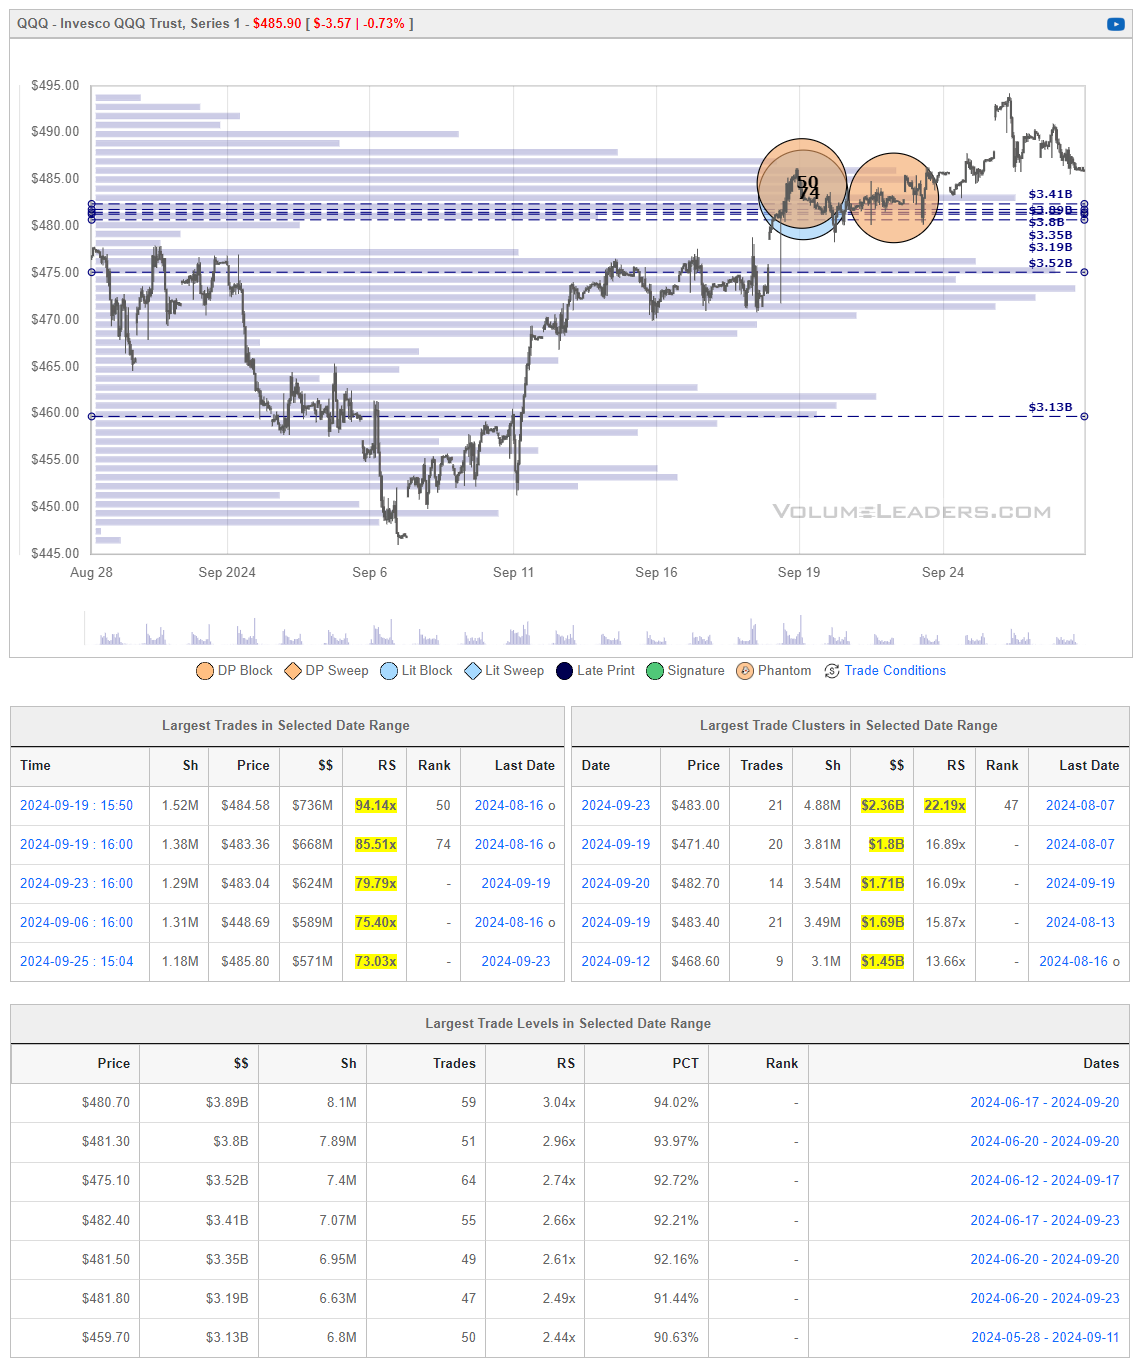
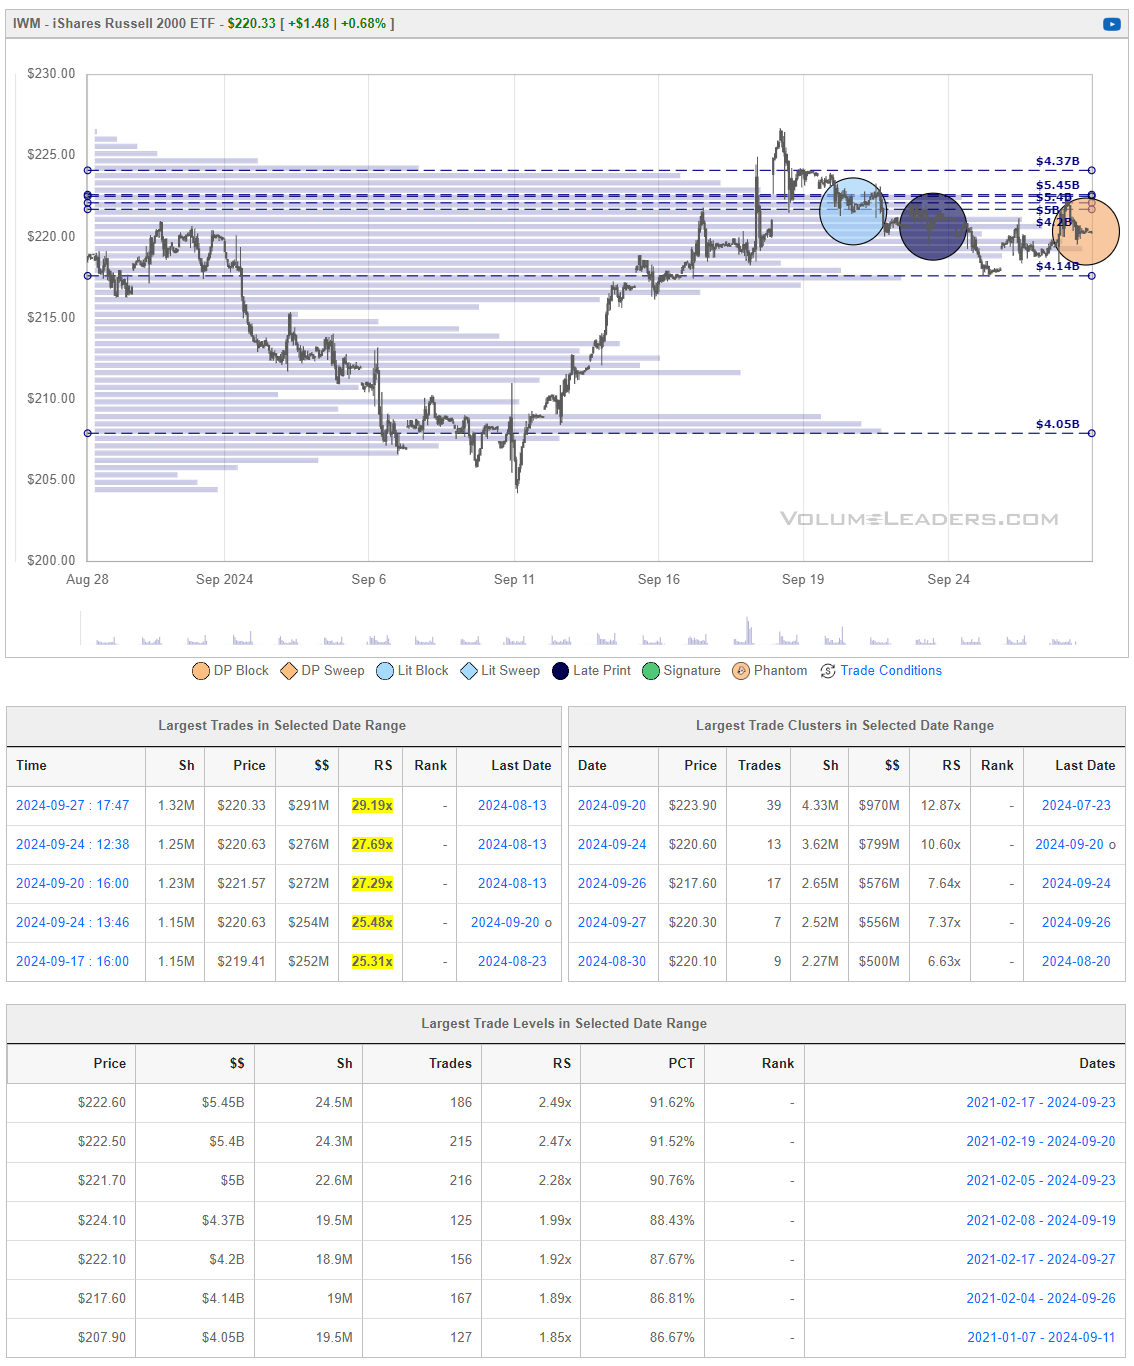
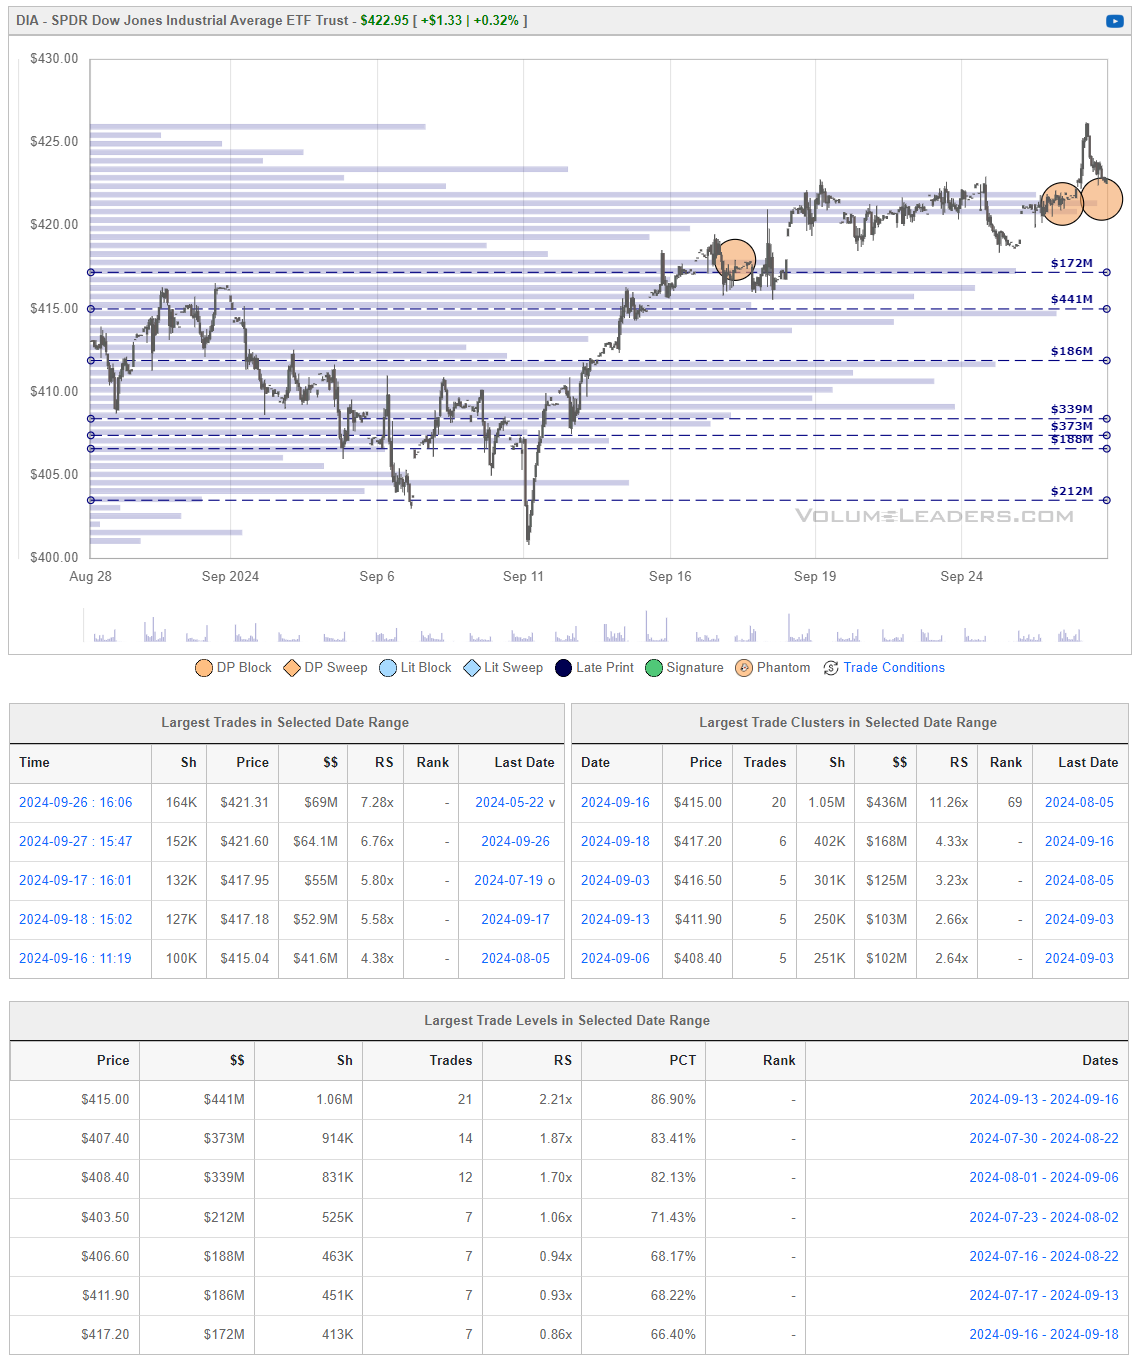
Institutional S/R Levels for Major Indices
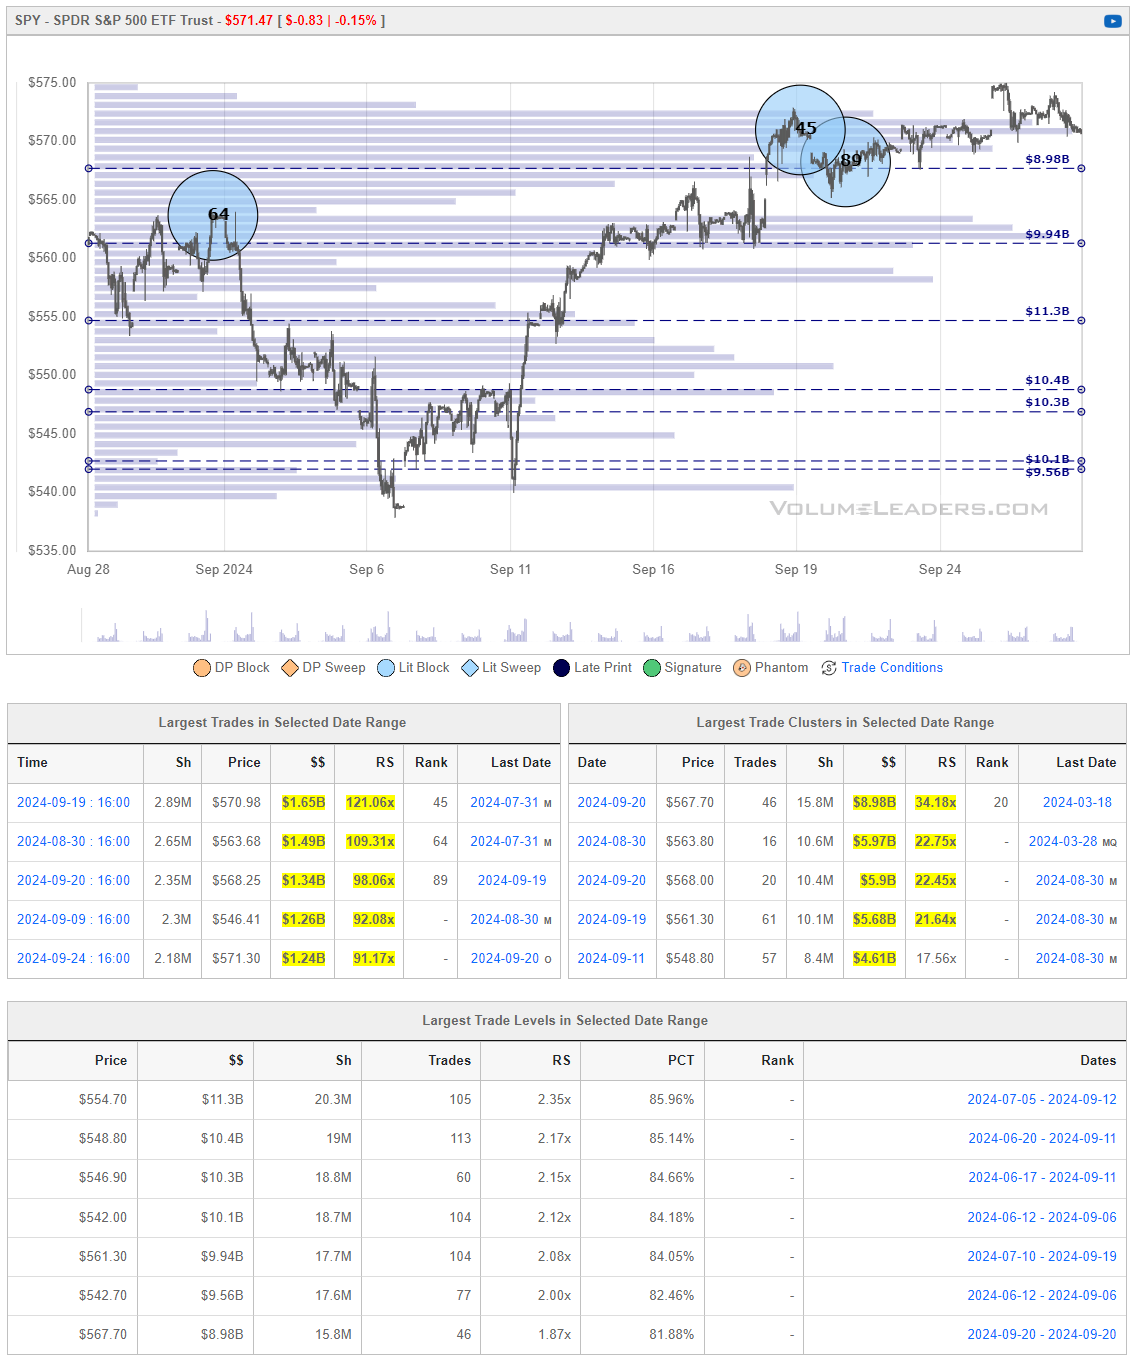
When you’re a large institutional player, your primary goal is to find liquidity - places to do a ton of business with the least amount of slippage possible. VolumeLeaders.com automatically identifies and visually plots the exact spots where institutions are doing business and where they are likely to return for more. It’s one of the primary reasons “support” and “resistance” concepts work and truly one of the reasons “price has memory”.
Levels from the VolumeLeaders.com platform can help you formulate trades theses about:
Where to add or take profit
Where to de-risk or hedge
What strikes to target for options
Where to expect support or resistance
And this is just a small sample; there are countless ways to leverage this information into trades that express your views on the market. The platform covers thousands of tickers on multiple timeframes to accommodate all types of traders. Observe for yourself how accurate the levels are by marking-up your charts with the information in the “Trade Levels” boxes I’m giving for free below and play-along in real-time this week. These charts cover recent sessions, but subs will get new levels as they develop, see the latest trades and institutional positioning, have access to levels from other time frames and so much more. When you watch these levels this week, I’m confident you’ll see how clear, intuitive and actionable this information is for yourself.
Top Institutional Order Flow
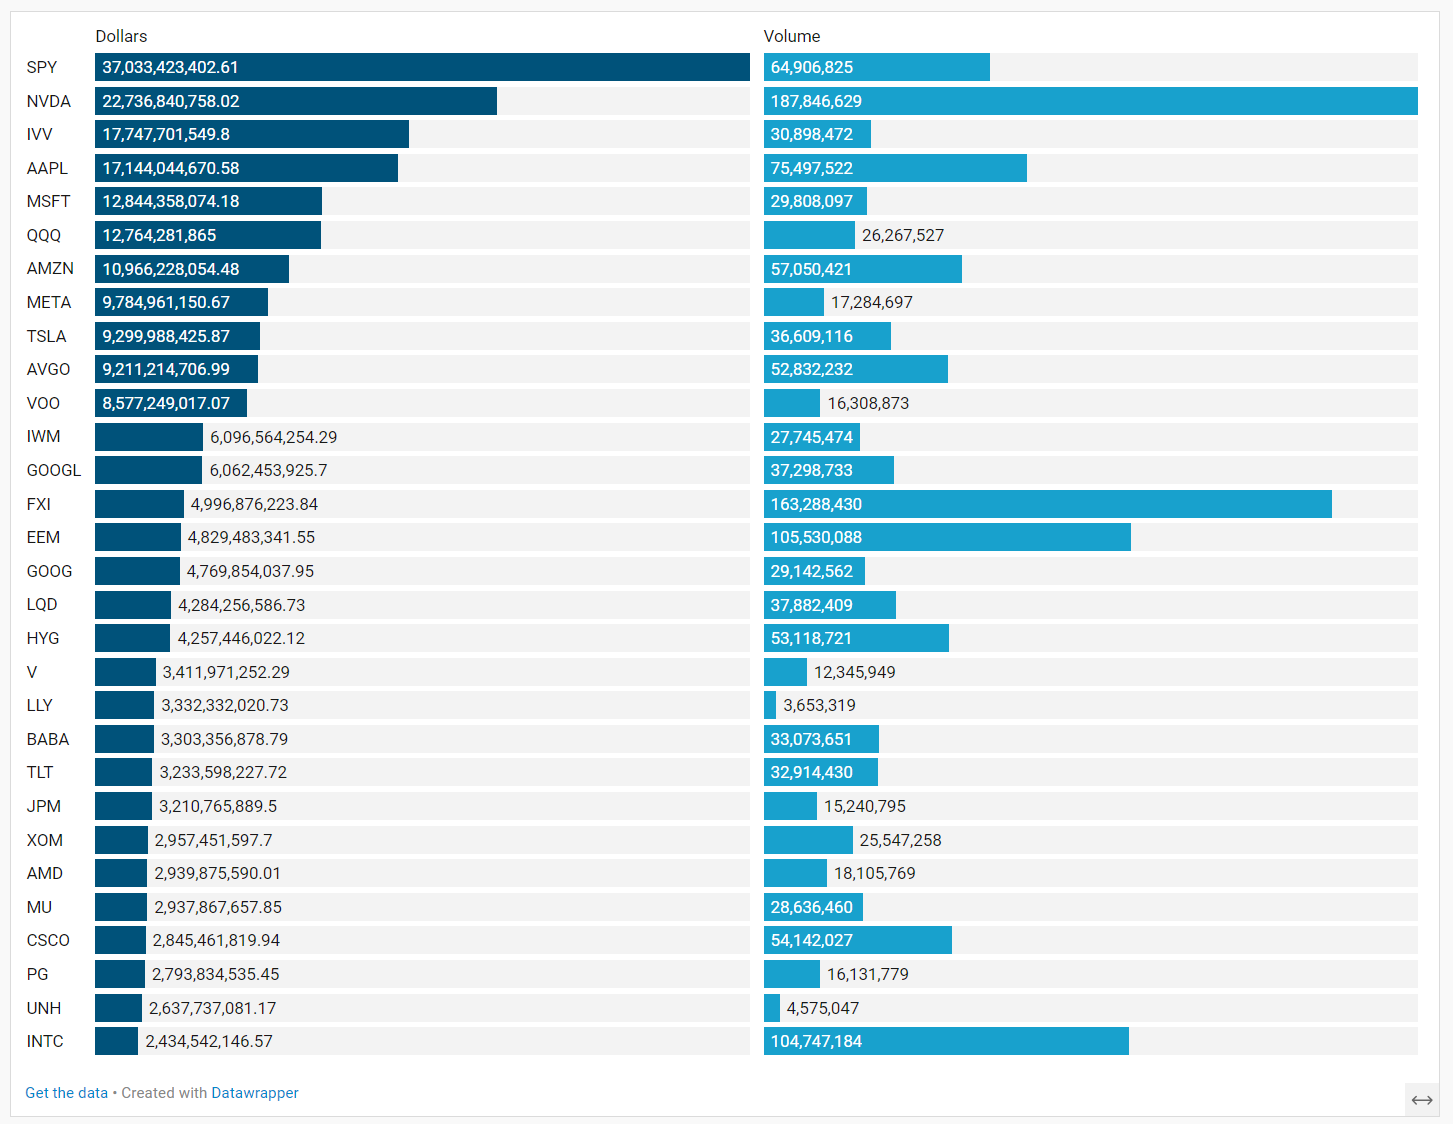
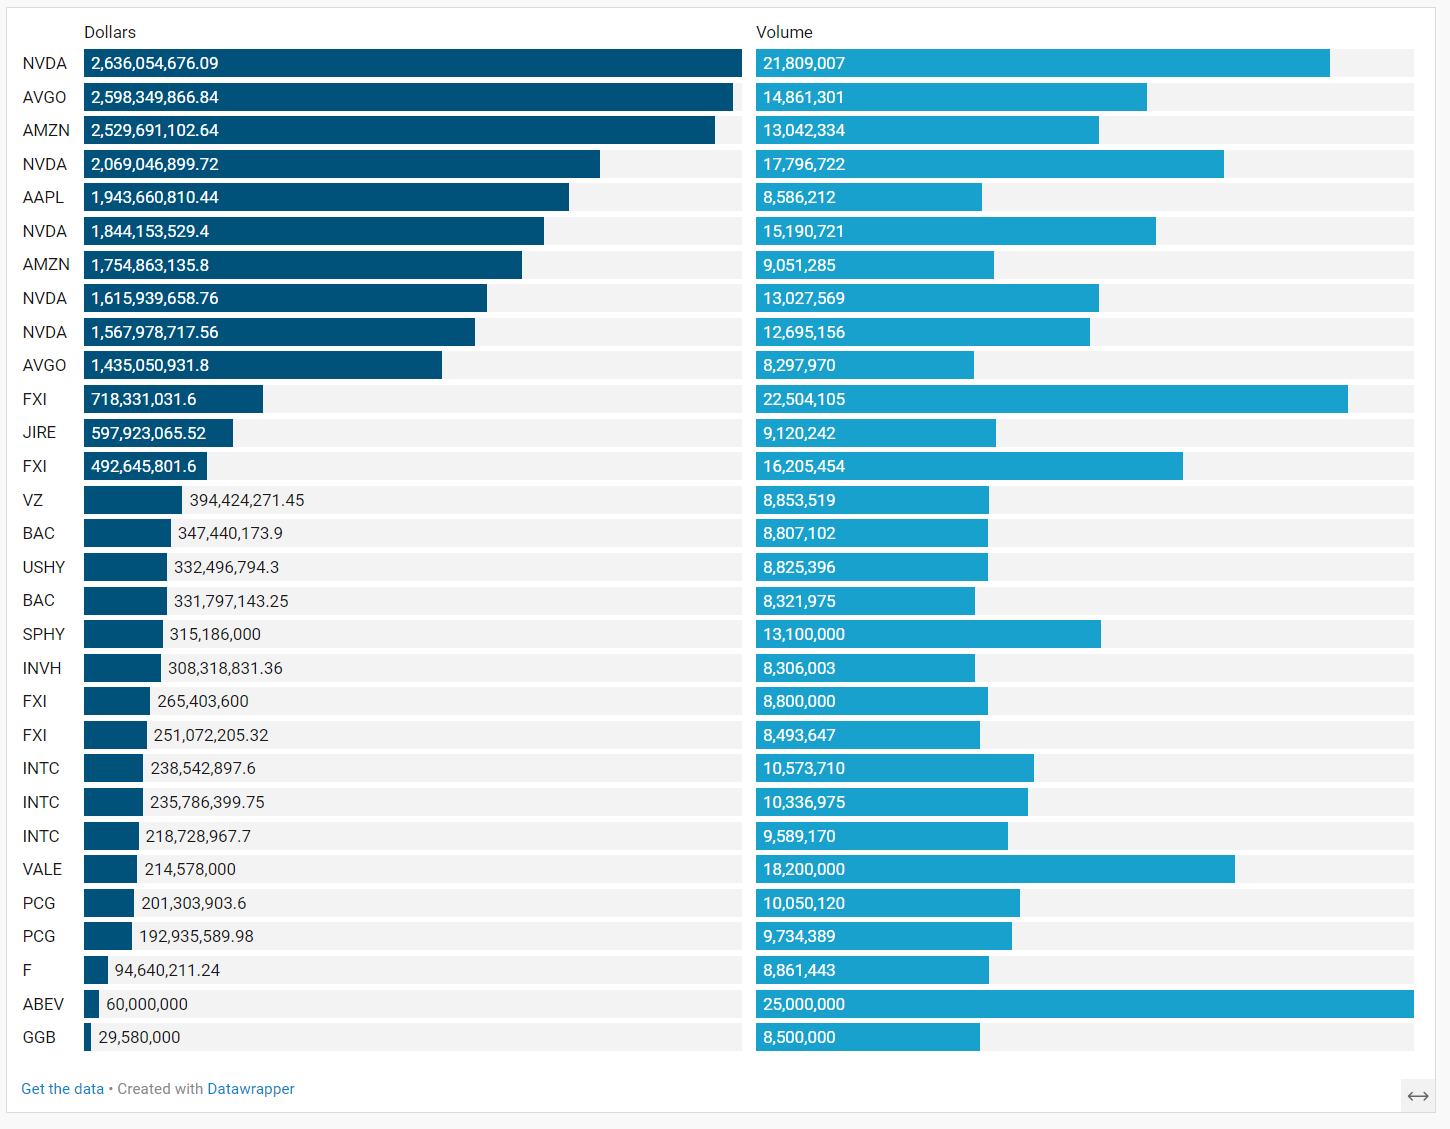
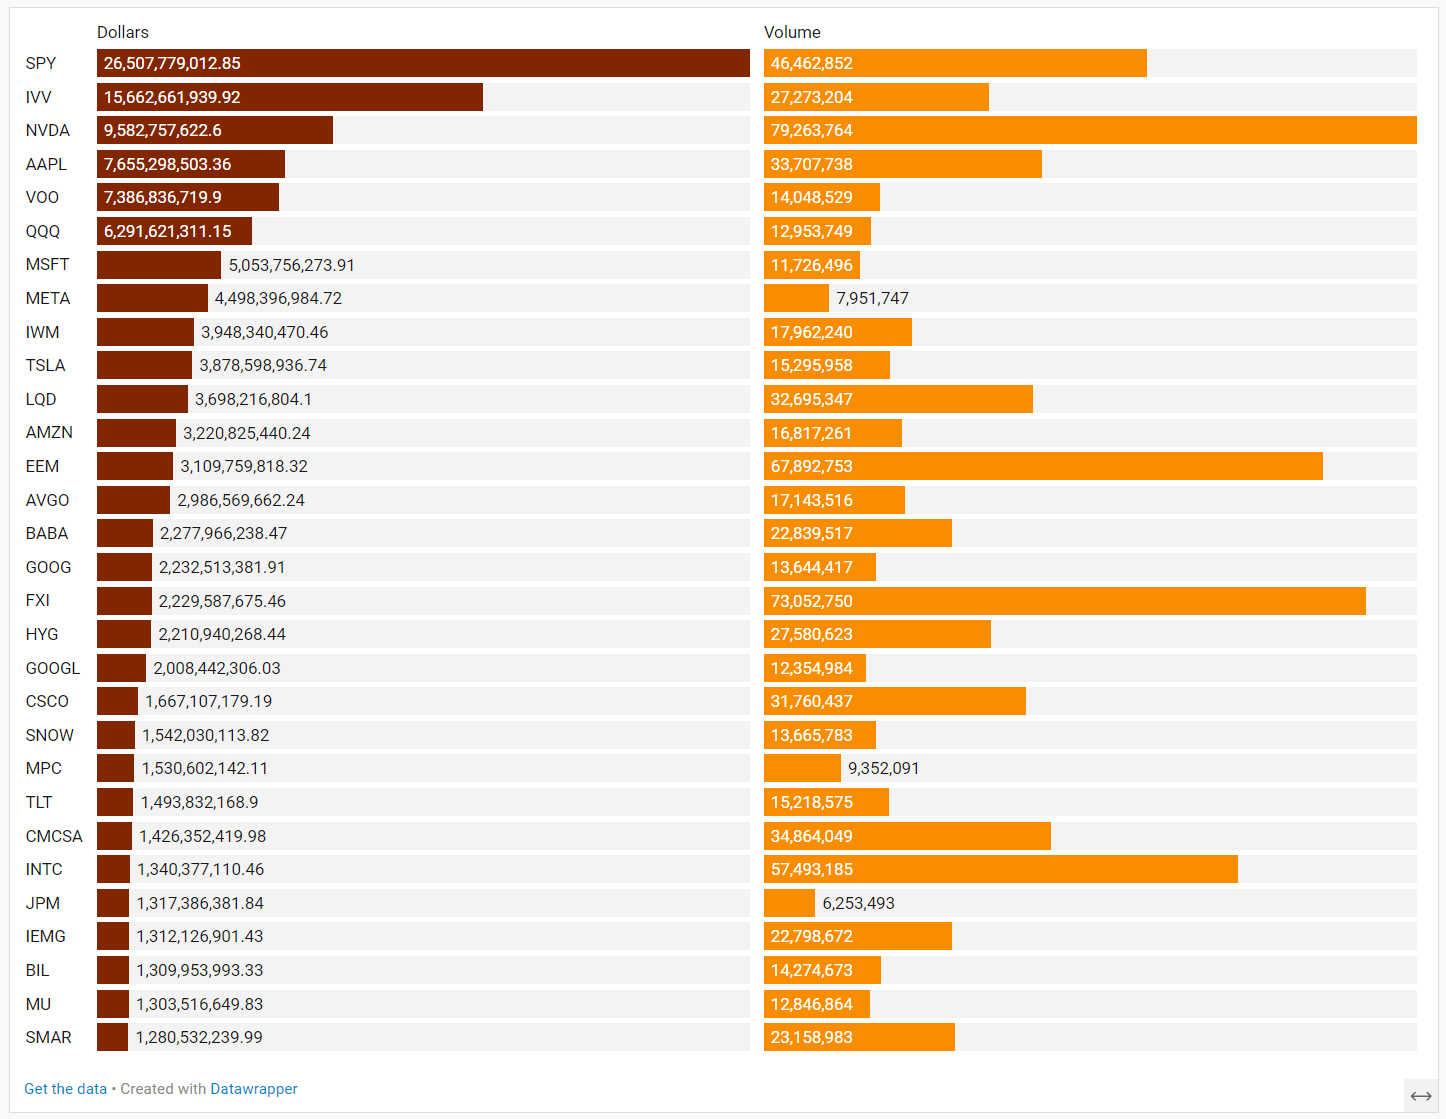
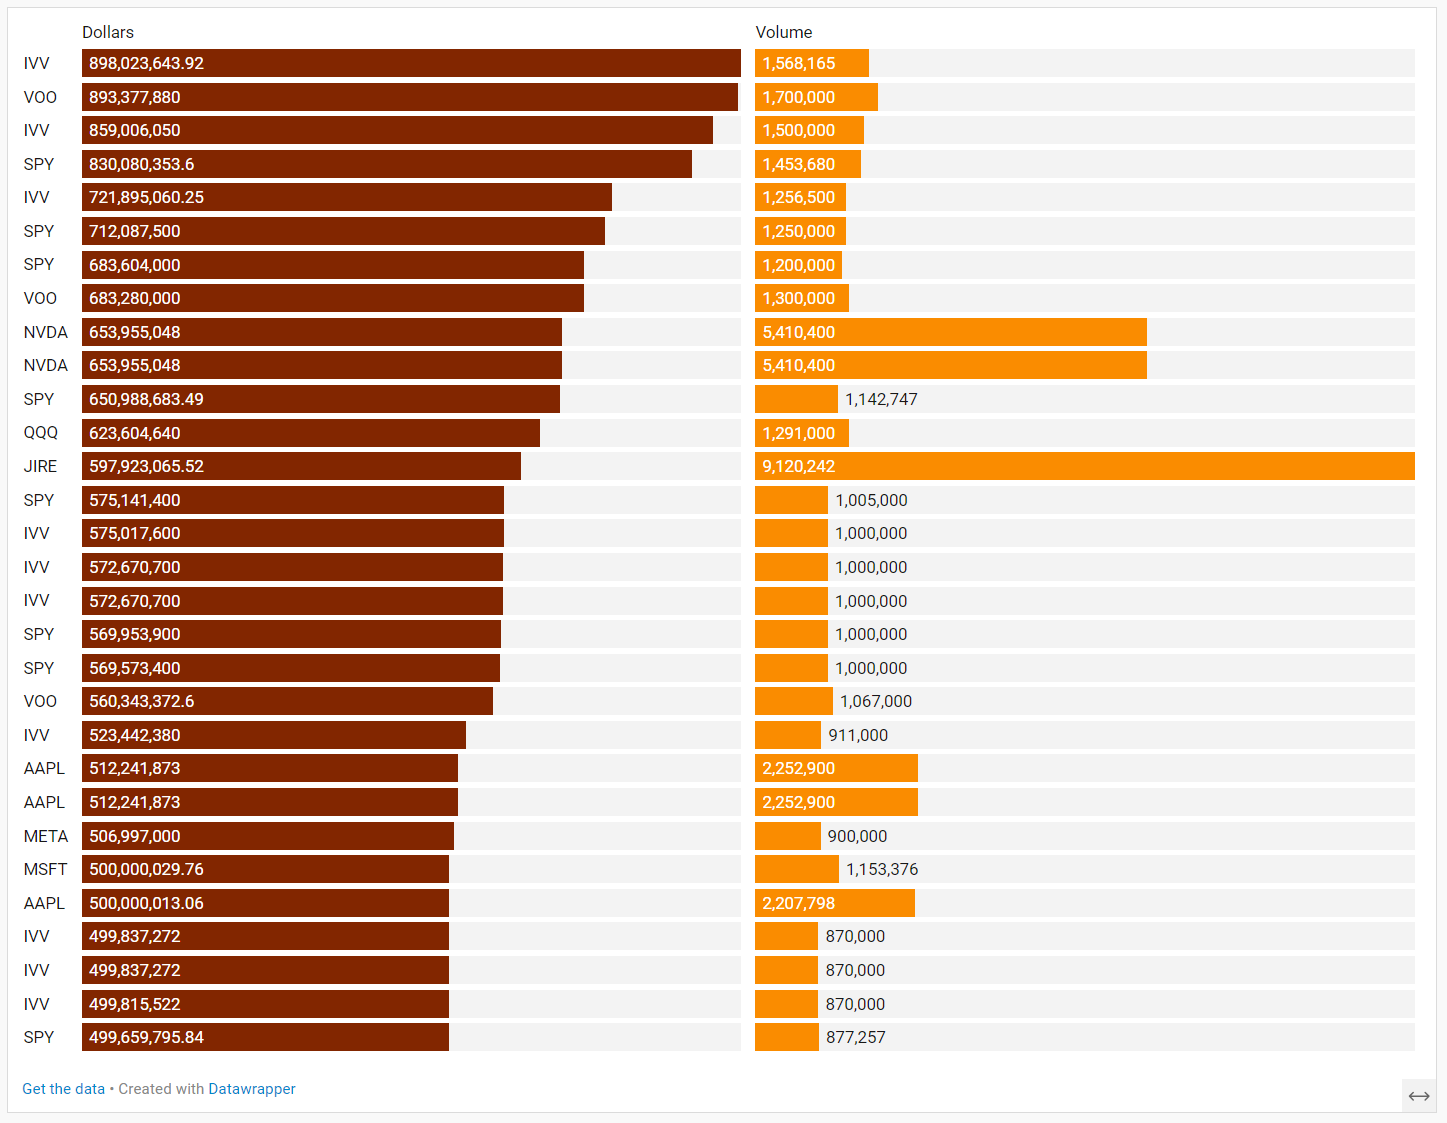
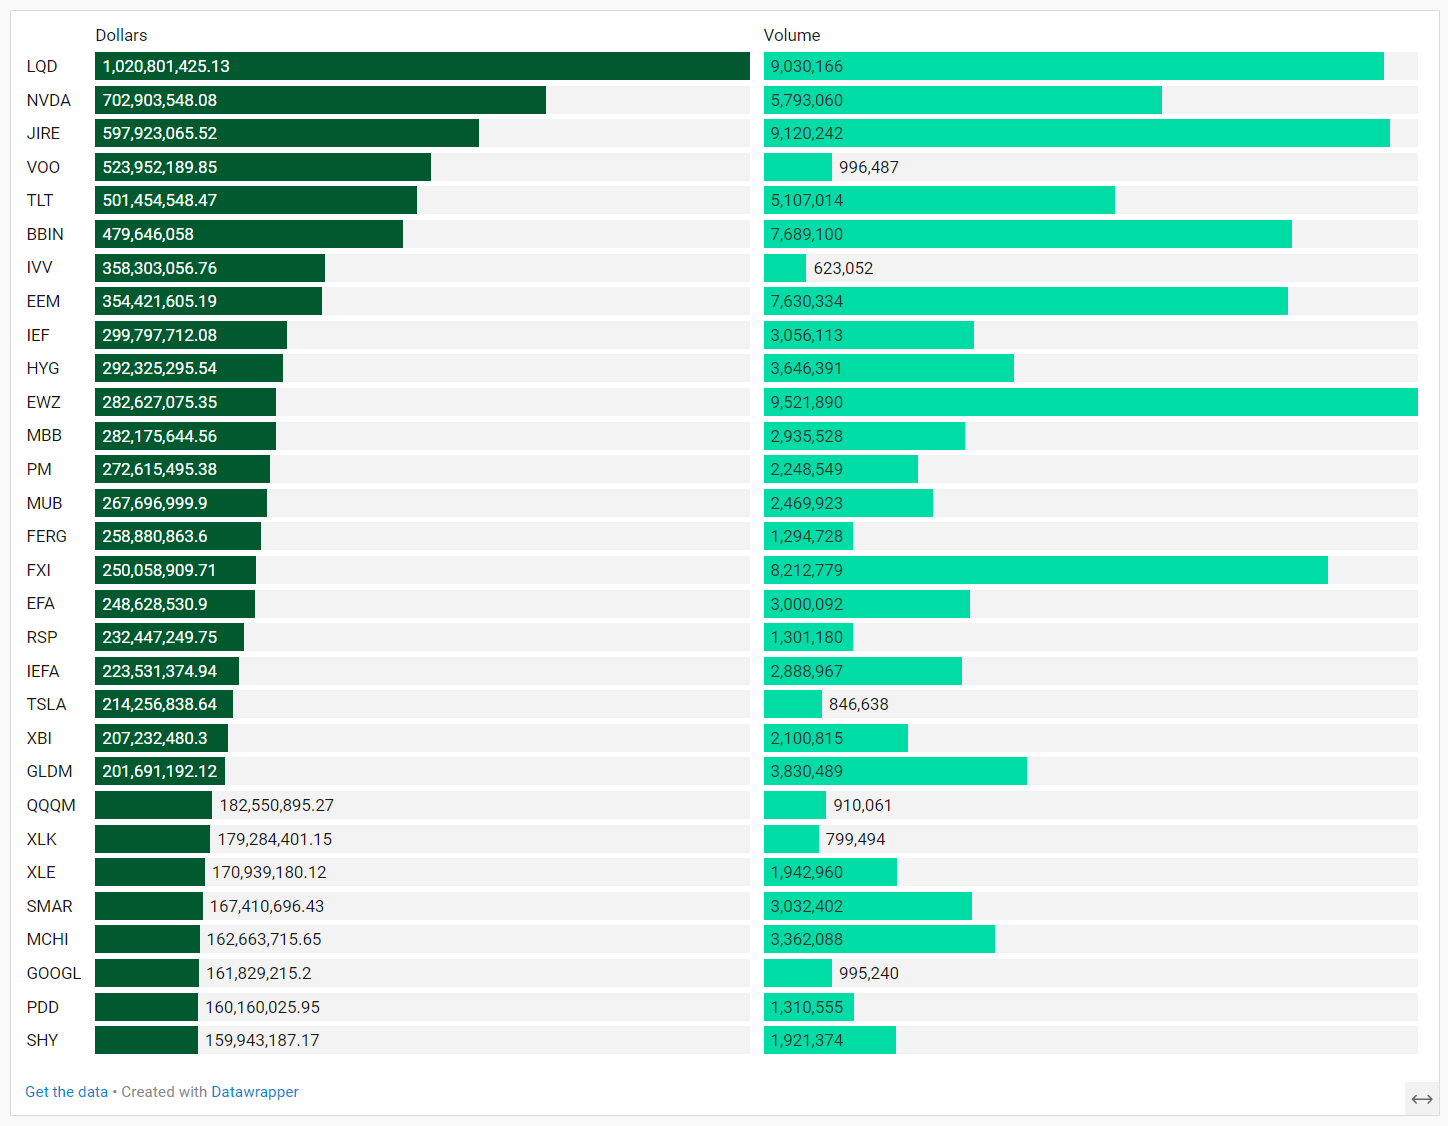
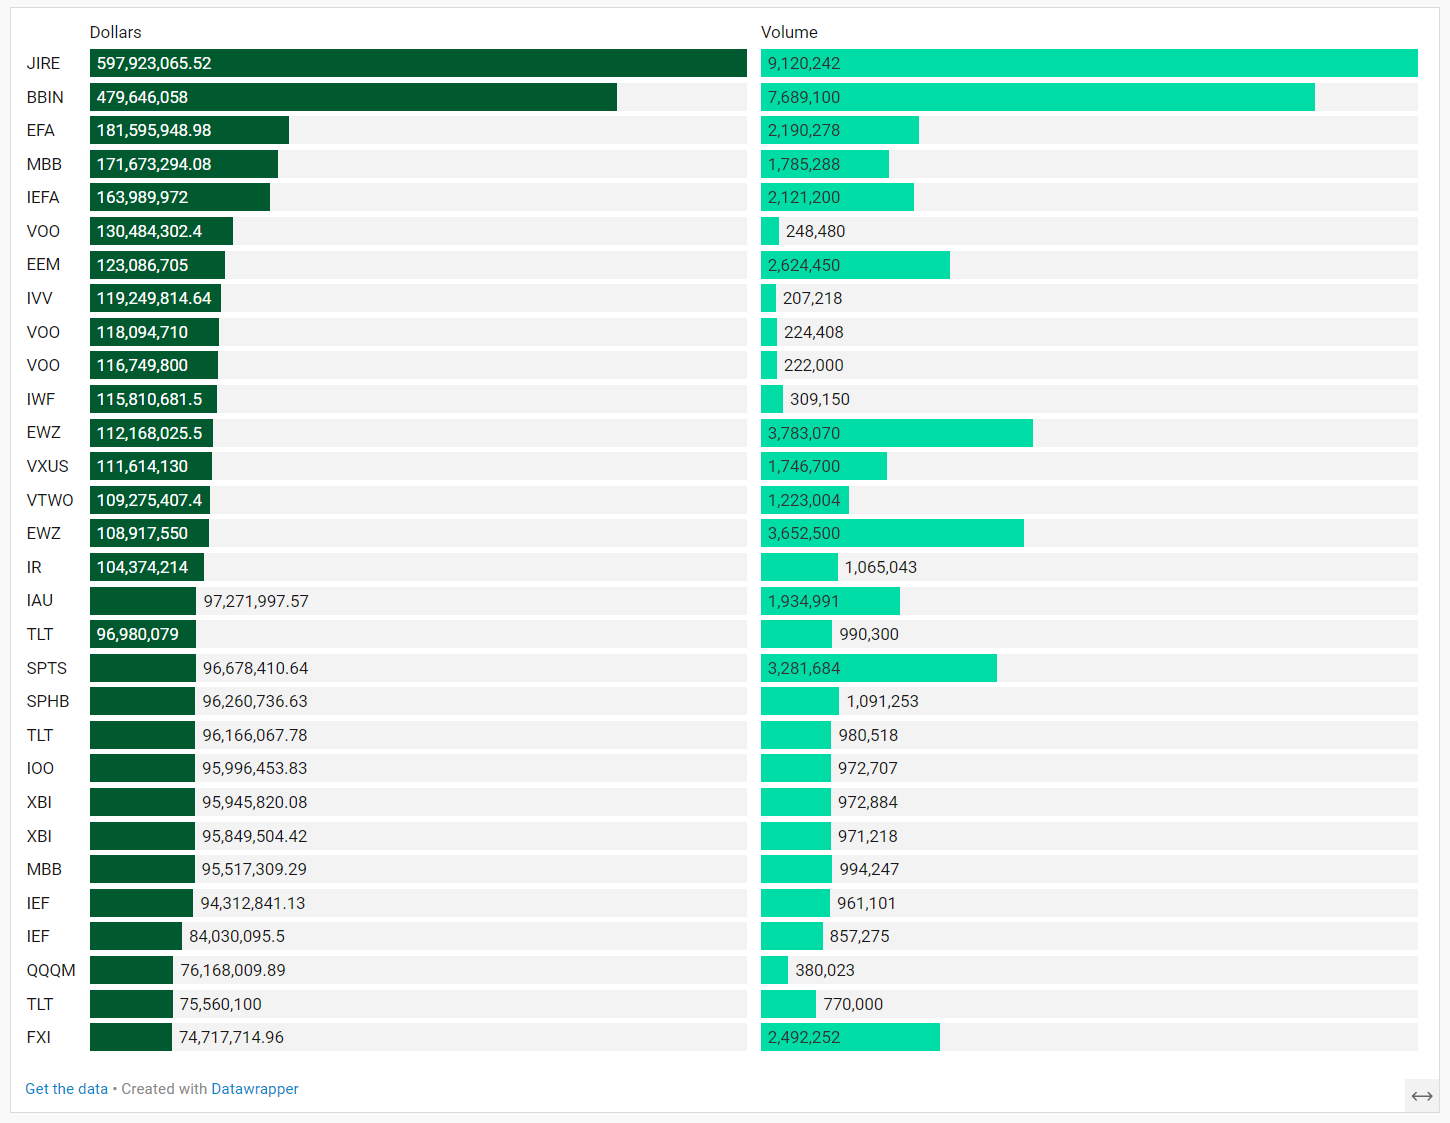
Many excellent trade ideas and sources of inspiration can be found in these prints. While only the top 30 from each group are displayed, the complete results are accessible in VolumeLeaders.com for your convenience to explore at any time. Remember to configure trade alerts within the platform to ensure you never overlook institutional order flows that capture your interest or are significant to you. The blue charts encompass all types of trades, including blocks on lit exchanges; the red/orange charts exclusively depict dark pool trades; and the green charts represent sweeps only.
Top Aggregate Dollars Transacted by Ticker
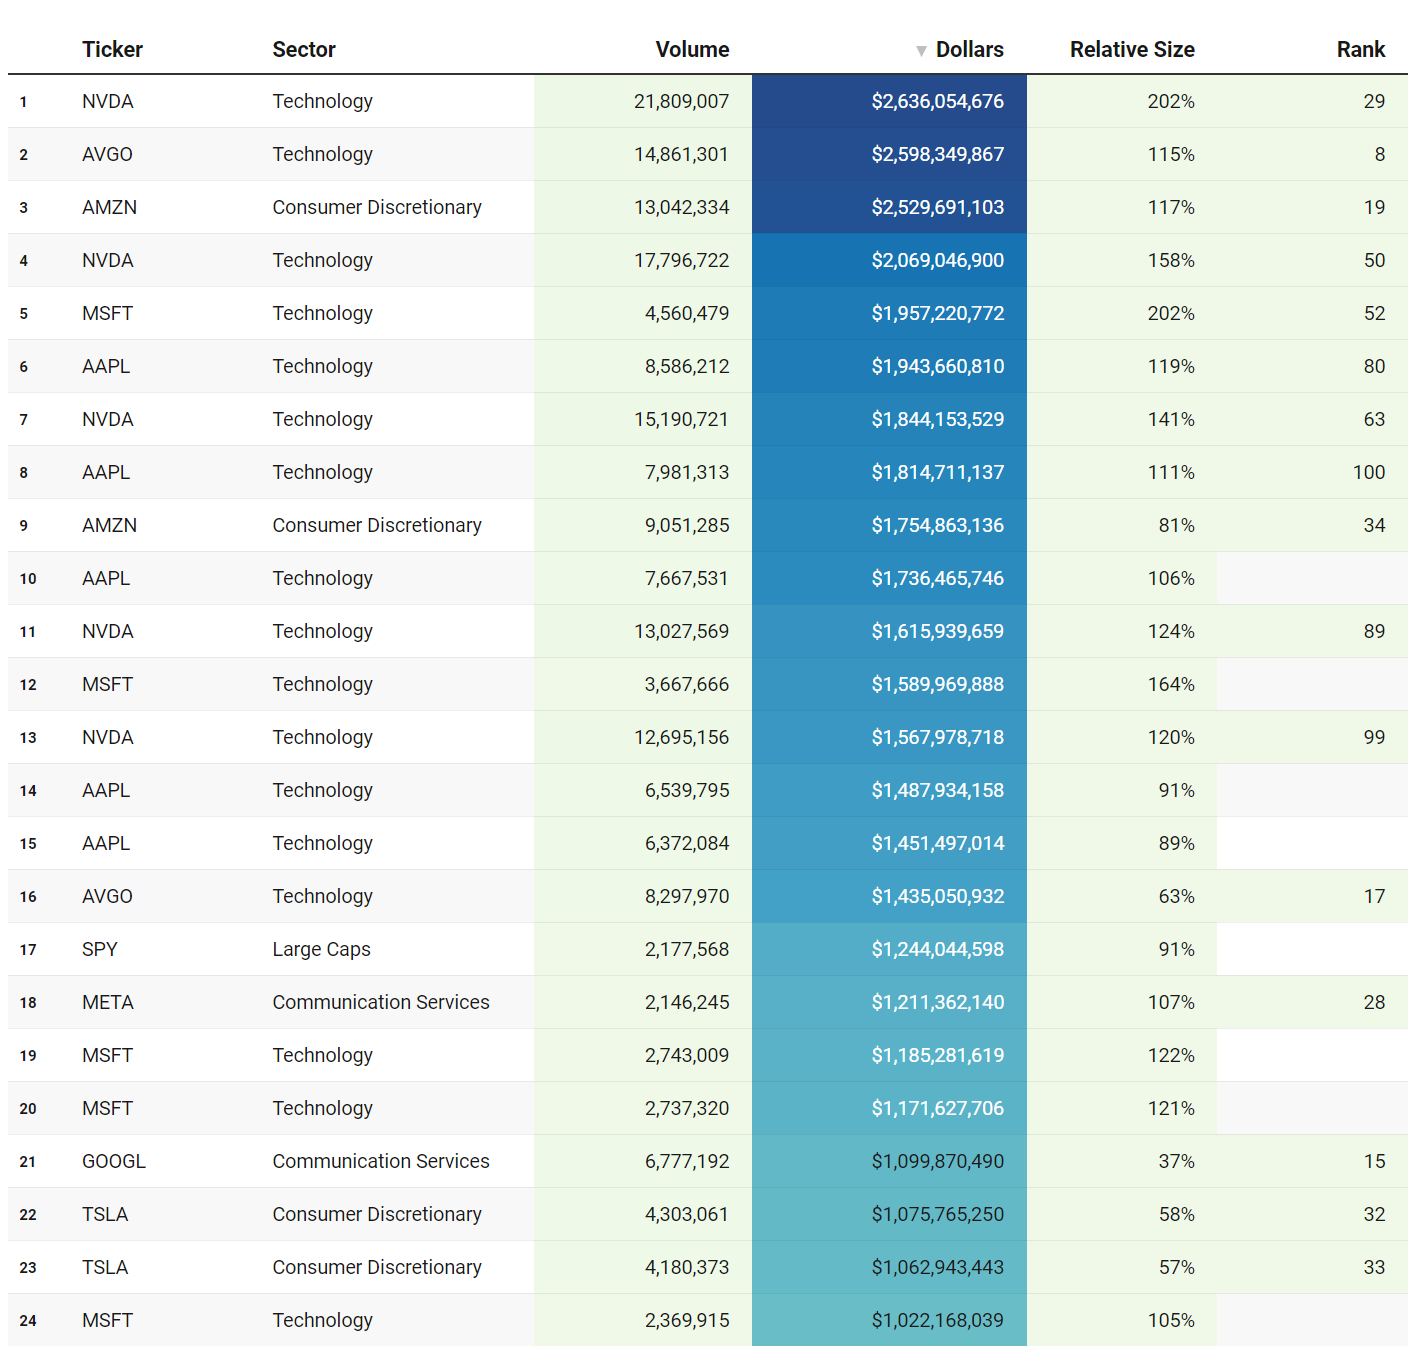
Largest Individual Trades by Dollars Transacted
Top Aggregate Dark Pool Activity by Ticker
Largest Individual Dark Pool Blocks by Dollars
Top Aggregate Sweeps by Ticker
Top Individual Sweeps by Dollars Transacted
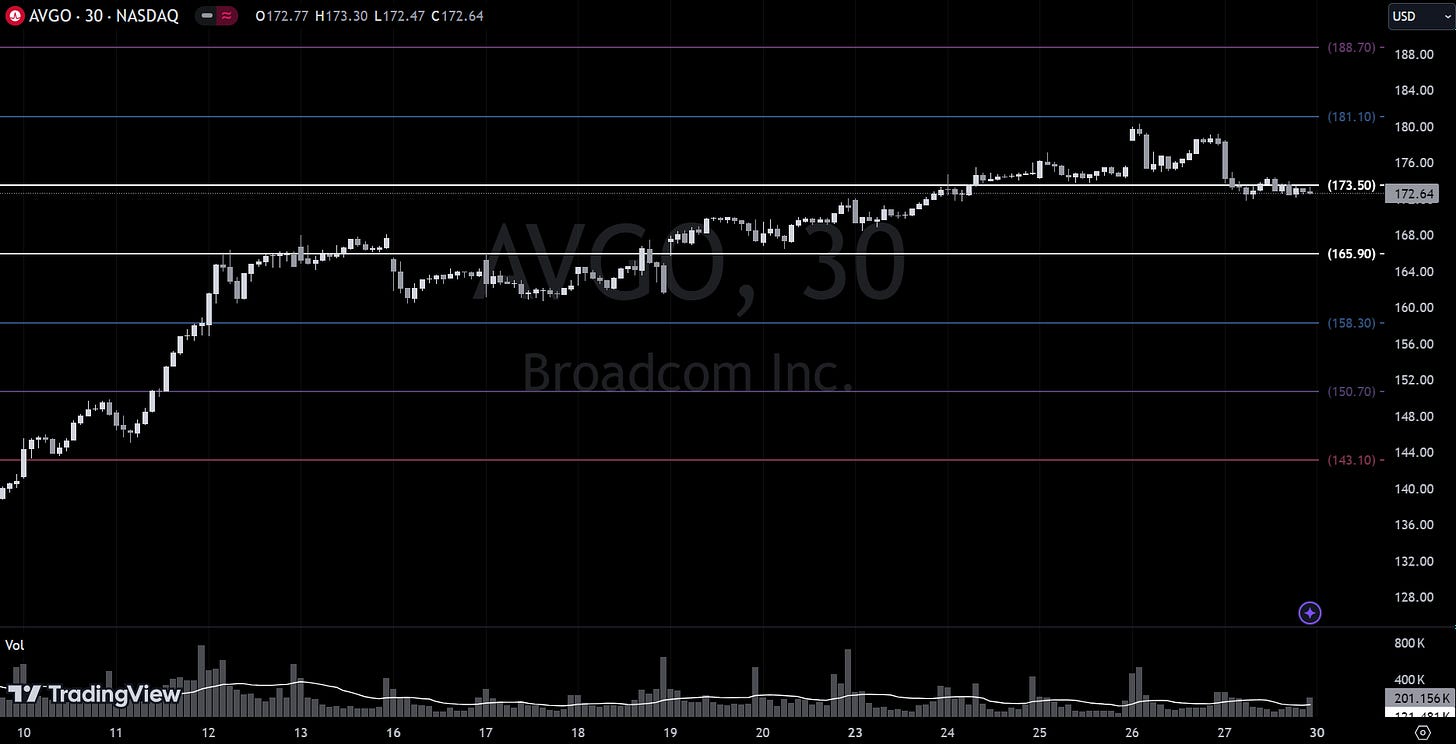
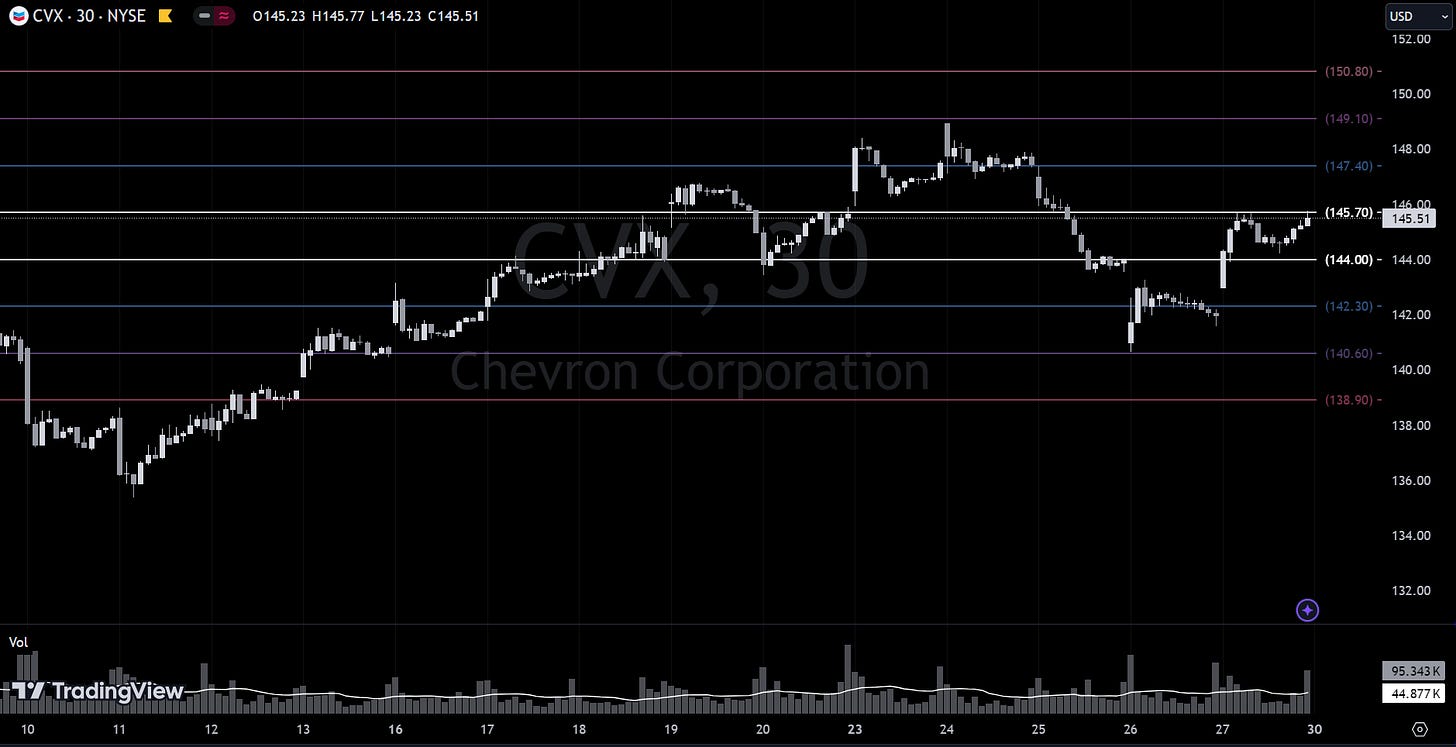
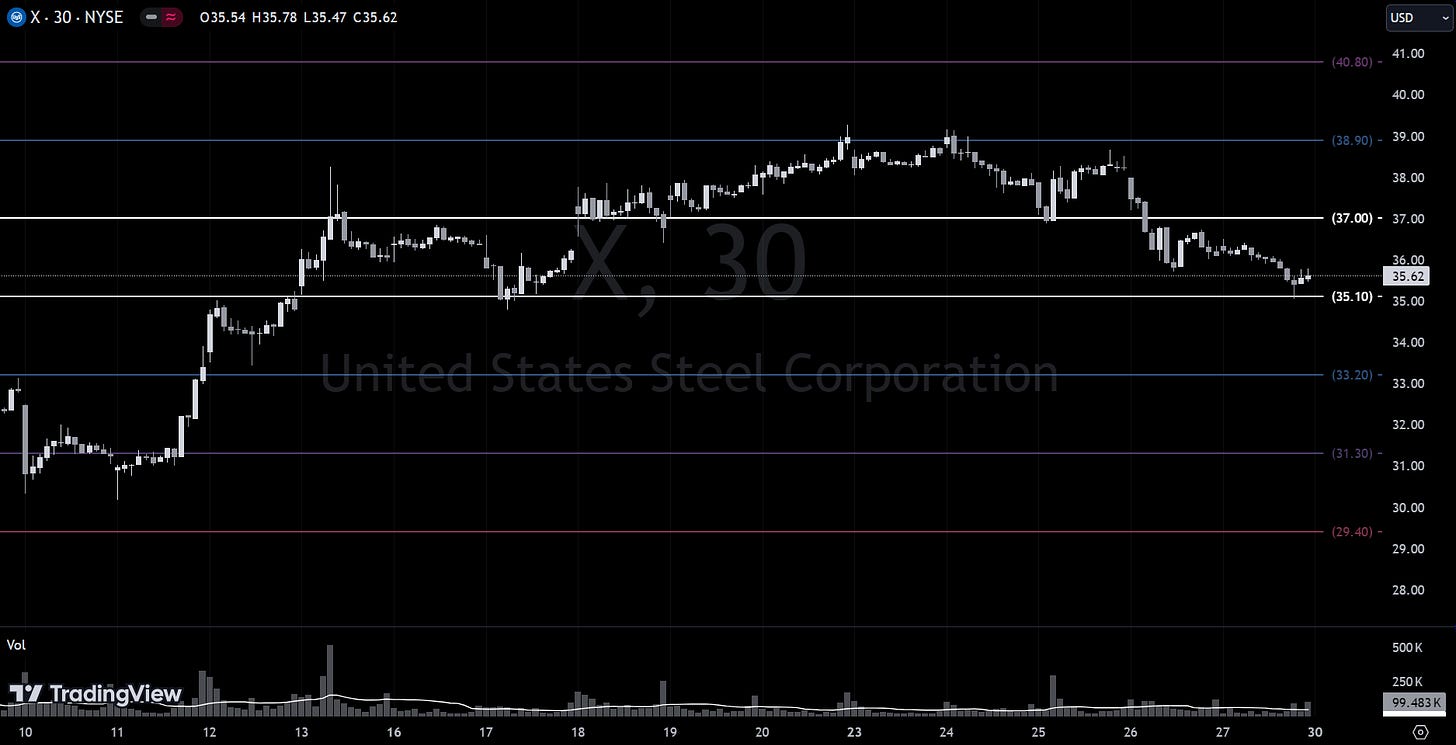
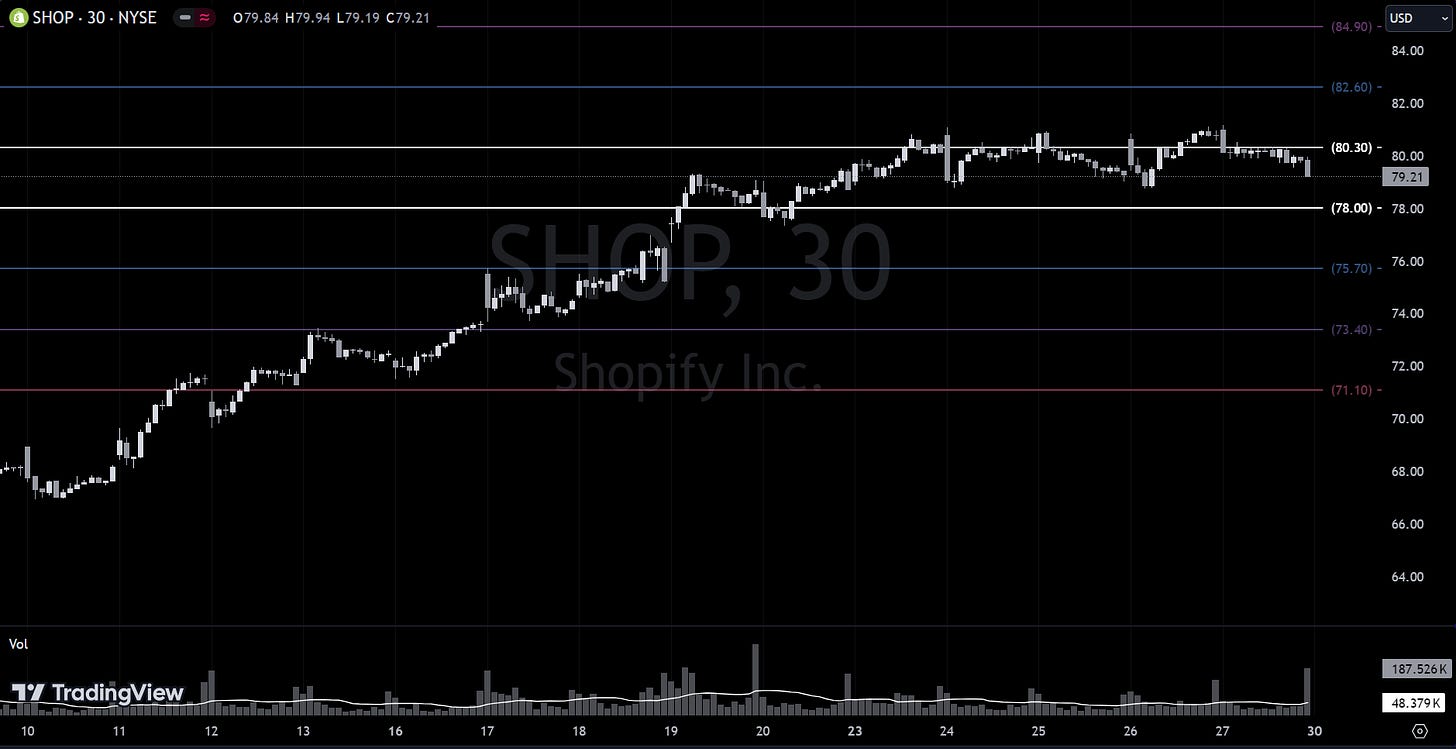
Institutional S/R Levels for Individual Tickers
Please read “Institutional S/R Levels For Major Indices” at the top of this stack to understand the nature and importance of what we’re looking at here visually. Institutions leave footprints that VolumeLeaders.com can illustrate for you while providing context to assess things like institutional conviction and urgency.
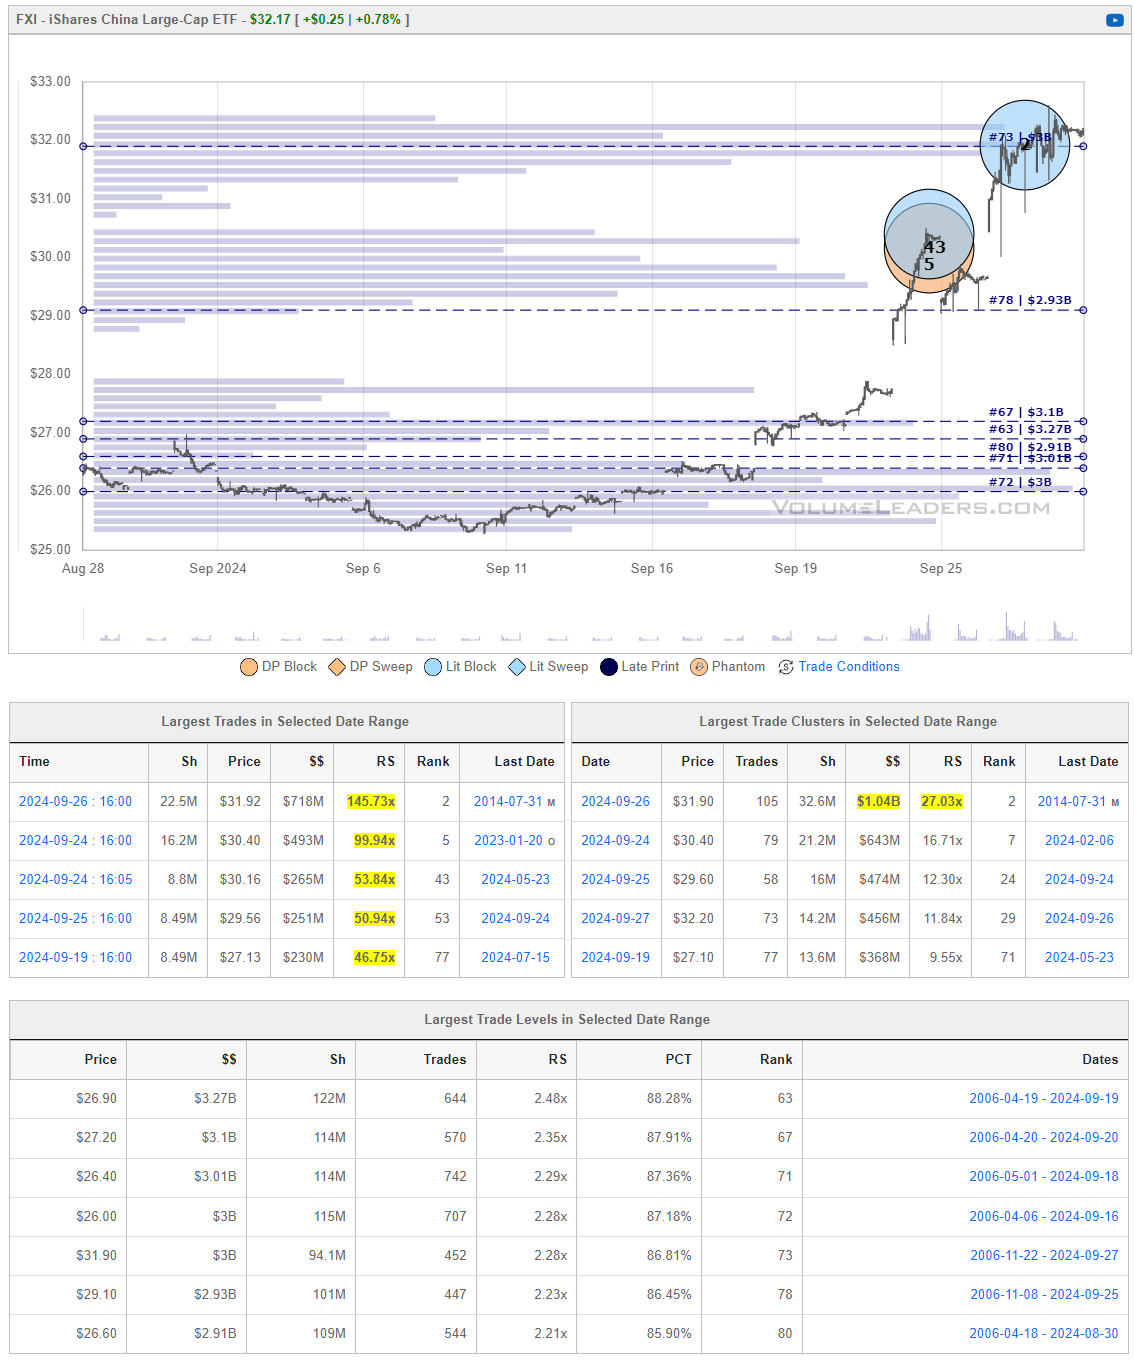
FXI, or iShares China Large-Cap ETF, is an exchange-traded fund that offers exposure to the 50 largest Chinese stocks traded on the Hong Kong Stock Exchange, tracking the FTSE China 50 Index. It's managed by BlackRock and was launched on October 5, 2004. The fund aims to provide investment results that correspond generally to the price and yield performance of its underlying index, which is a market-cap-weighted index of Chinese equities.
On shorter timeframes this one looks like a flash-in-the-pan but if you login to VL and look at the 30-day chart or higher, you can clearly see the institutional accumulation at the lows. It’s going to take some time to let out all of that inventory and I think they have it since the stimmy news coming out of China will take time to play out. Chinese equities experienced their biggest weekly rally since 2008, buoyed by a series of stimulus measures introduced by Beijing, aimed at boosting the economy.
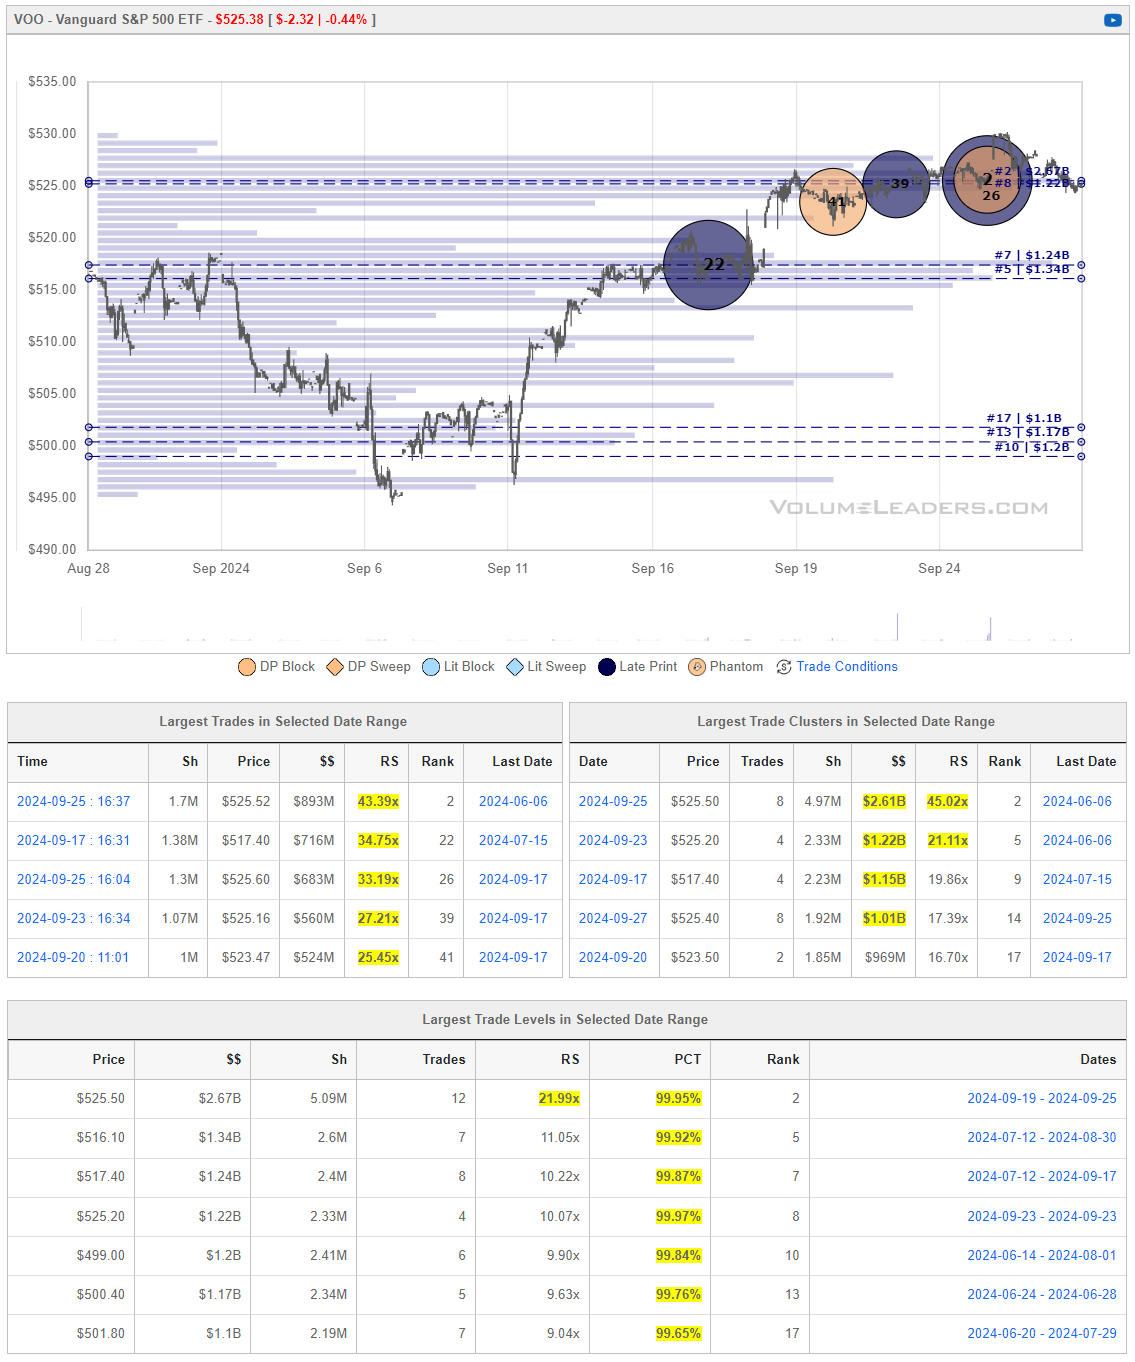
The VOO, or Vanguard S&P 500 ETF, is designed to track the S&P 500 Index, which is a benchmark for U.S. equity market performance and consists of 500 of the largest companies in the U.S. It employs a full replication strategy to maintain a portfolio that reflects the S&P 500. This ETF is popular among investors looking for exposure to general U.S. stock market performance through a single fund. With its inception in 2010, VOO is known for its low expense ratio and high liquidity, making it a favorable choice for long-term investors seeking cost-effective and broad market exposure.
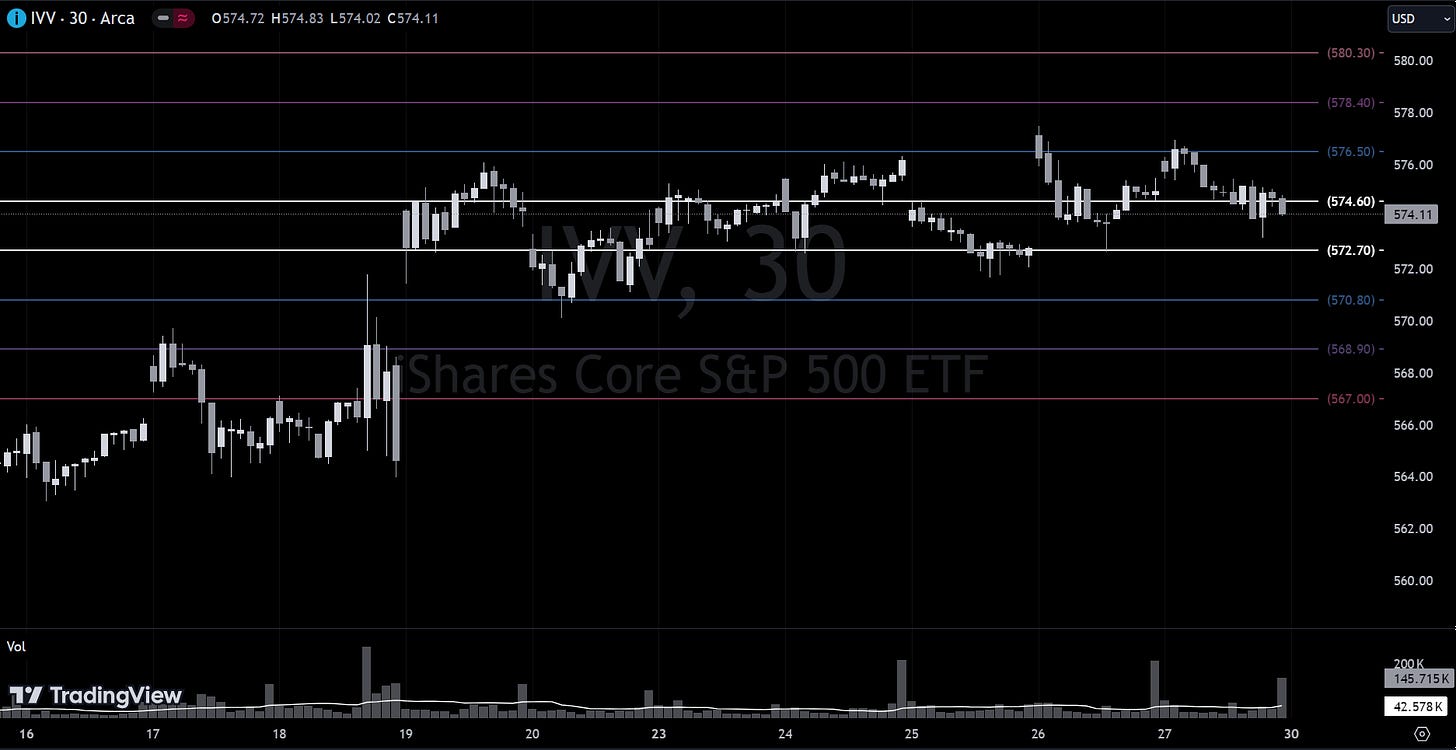
The volume we’ve seen in recent days has been incredible, including a #2-ranked trade (second largest in the ticker’s history). Playing level-to-level as we do, you’re going to want to monitor $525.52; setup an alert in your trading platform. If price has trouble holding there, it looks like we could trade back to $517.40 and that would be the first place to look for some support. VL users - while you’re looking at this, also checkout IVV 0.00%↑ in the platform
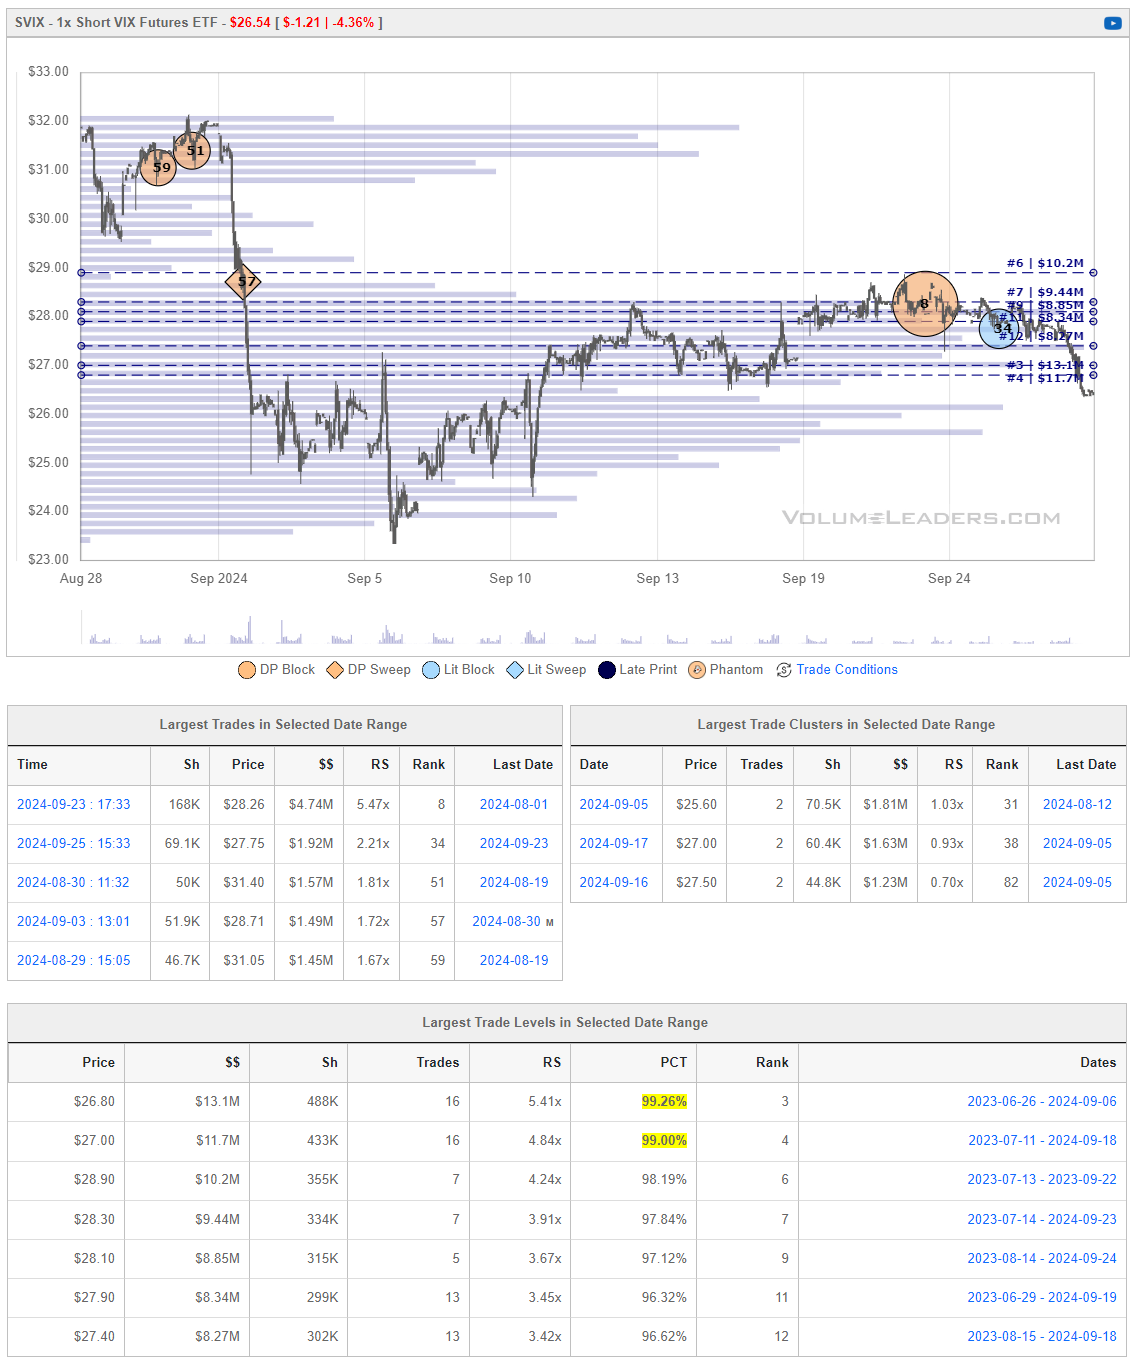
The SVIX, or -1x Short VIX Futures ETF, is an inverse VIX-linked exchange-traded fund that aims to provide daily investment results, before fees and expenses, that generally correspond to the inverse of the daily performance of the Short VIX Futures Index. This index primarily consists of first and second-month VIX futures positions with a weighted average maturity of one month.
Launched on March 30, 2022, SVIX is designed as a short-term trading tool rather than a long-term investment vehicle. It is suited for traders looking to capitalize on daily inverse movements of short-term volatility in the VIX futures market. The ETF can be a strategic option for investors seeking to hedge against or benefit from decreases in market volatility.
Due to its inverse nature and focus on short-term futures, the SVIX is particularly sensitive to movements in the VIX, and its value can fluctuate significantly within very short periods. As such, it requires active management and monitoring.
This ticker was an absolute printing press last year. Only since July this year have we seen real supply some in. You can clearly see institutional involvement in the chart below in the $27-$28 range which is a great poor-man’s sentiment gauge right now. Price closing where it did today, this range presents as supply which has bearish undertones. If price can reclaim levels above, bulls can party-on.
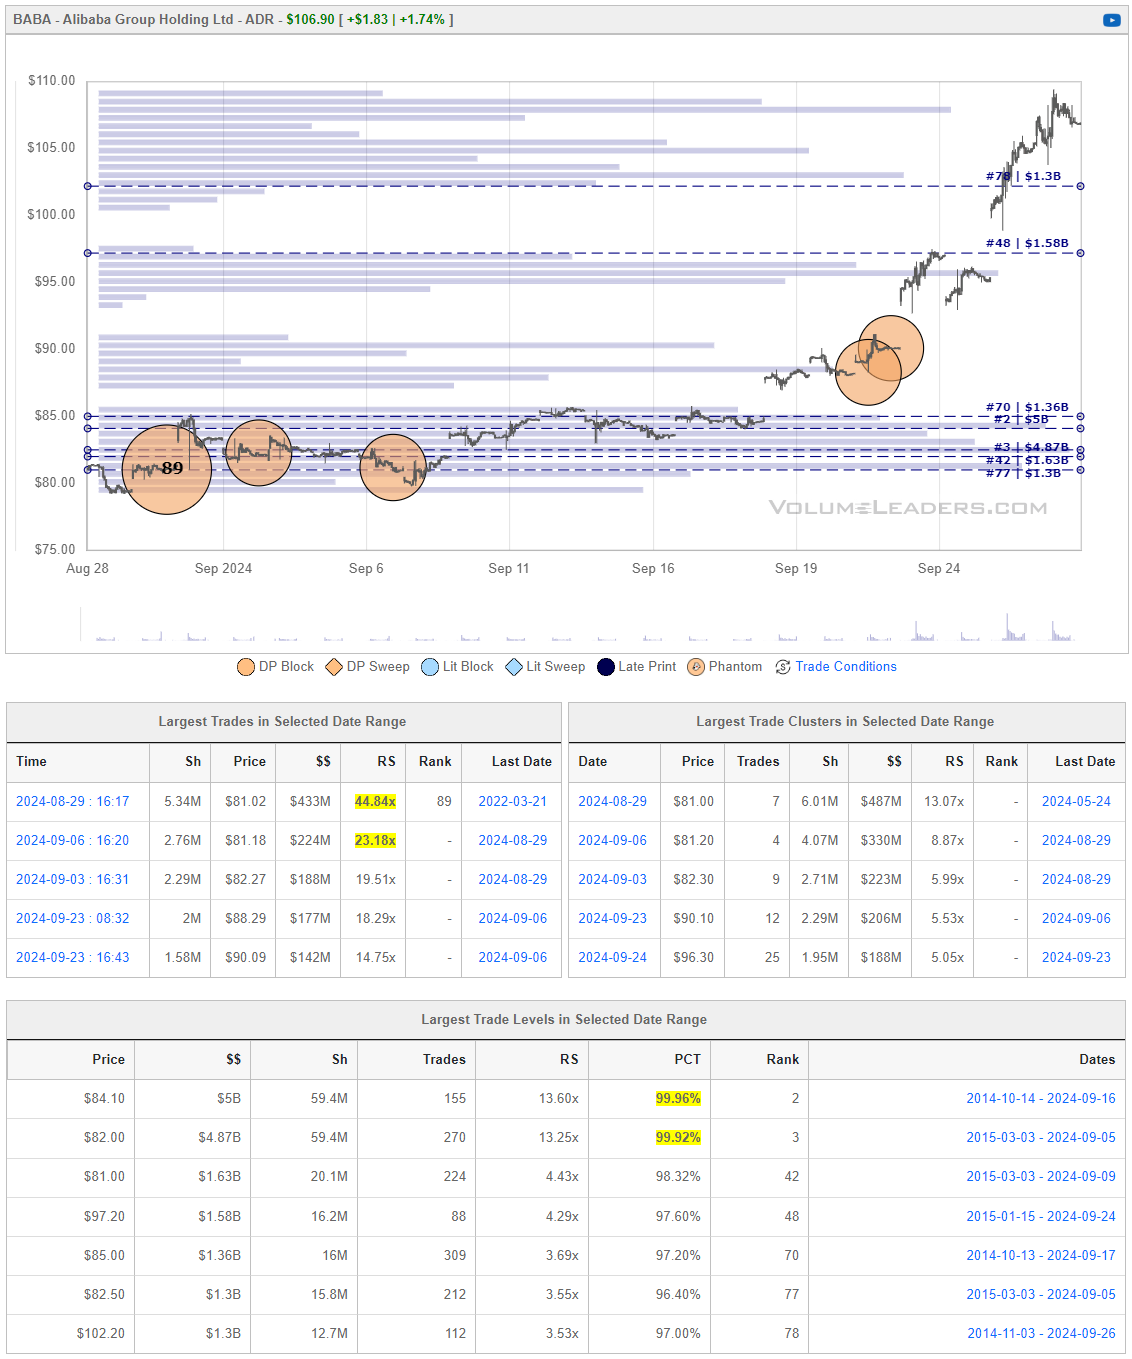
One China-name that everyone knows to go with the FXI above. The setup is broadly similar and that won’t be much of a surprise as you check out other names in the platform that fit this thematic. Not much to add except a cautionary tale about chasing price: It’s better to watch a move you wished you were in than to be in a move you wish you weren’t. If you want a piece of this action, wait for a pullback, levels below.
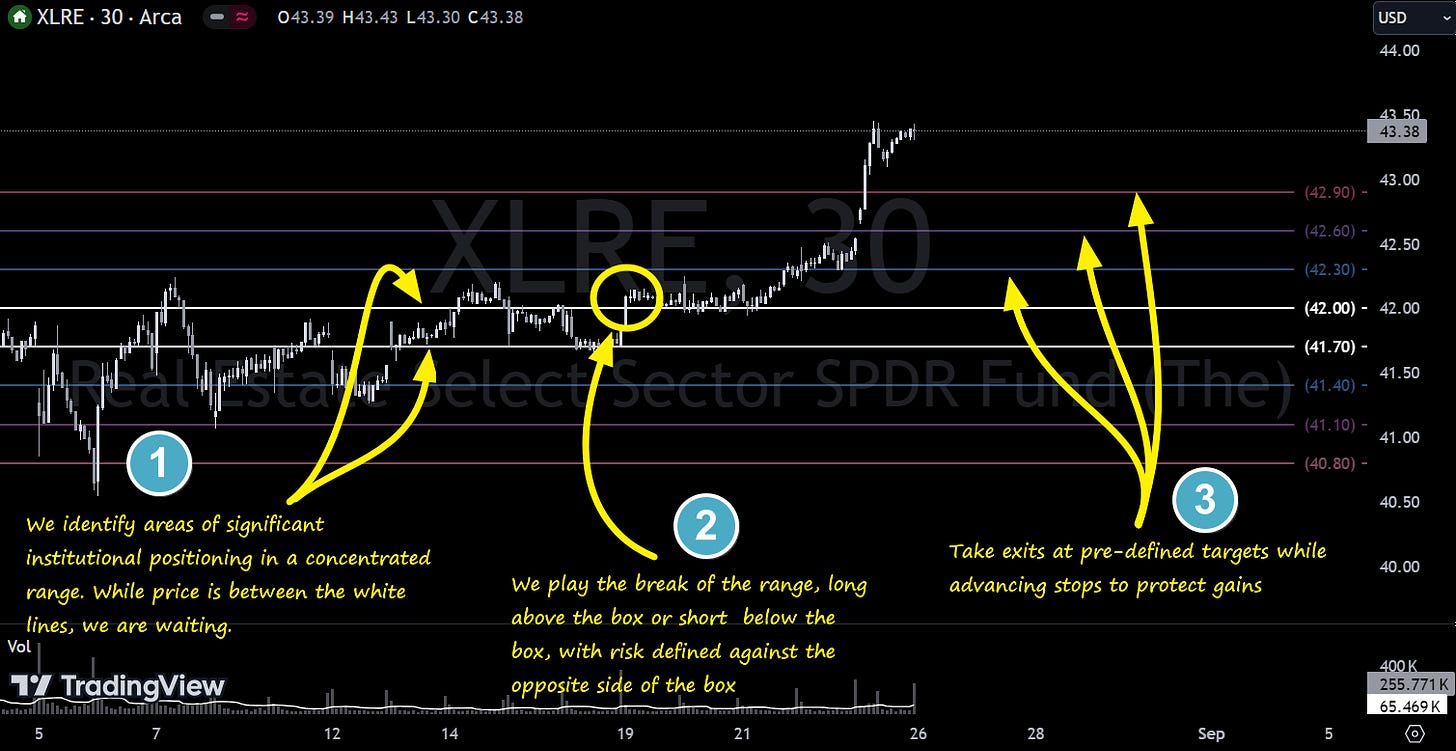
VL Precision Swings
This week we’re featuring additional screened trade ideas from one of our backtested proprietary signals for tactical swings called IBB - Institutional Breakout Boxes. The IBB Setup identifies an area of significant institutional positioning within a tight, concentrated price range, forming what we call a breakout box. This setup captures the potential energy built up as large players accumulate or distribute positions, creating a high-probability opportunity for explosive moves once the price breaks out of this zone. The precision of this setup allows traders to capitalize on the momentum generated by institutional forces, with clearly defined risk and reward parameters. These trades typically last from 2-days to 2-weeks and given targets are designed for tactical swings. Moreover, for longer-term swing traders, these ideas often provide excellent entries that can help get you into risk-free runners quickly. I highly encourage you to revisit prior recommendations - there aren’t just a few big winners that kept running, there are many, all due to the power of institutional positioning.
Note, these are shared for educational and entertainment purposes only and do not constitute financial advice.Here’s an example from XLRE:
Let’s see how last week’s setups played out. If you took any of these yourself, let us know in the comments!
ACWI: ⭐⭐⭐ triggered long, +1.04%, all targets met; this continued to run for +3.35%
AAPL: this is the still stuck in the box and is going to be a huge mover on the breakout. Keep an eye on this one.
ABM: ⭐ triggered short, +2.53%, only met T1. Stopped on remainder. Price is back in the box and can still be played.
ABT: ⭐ triggered short, +0.75%, only met T1 so far, runners on for other targets.
ADBE: triggered short, +1.51%, no targets yet met
AEO:⭐⭐, triggered long, +6.72%, T1 + T2 met, runners on for T3.
ALLY: triggered long, +0.18%, no targets yet met.
APD:⭐⭐⭐, +4.3%, all targets met.
BIO:⭐, triggered short, +1.82%, T1 met and remainder of position stopped.
BRK.B: triggered short, stopped for a 0.89% loss before any targets could be met.
CHD: triggered short, stopped for 0.98% loss before any targets could be met.
CUBE:⭐ triggered short, +1.14%, T1 met, runners still on for deeper targets.
GOOG: triggered short, full stop for -1.39%. Another name stuck in it’s IBB.
HSY:⭐ triggered short, +1.23%, T1 met and runners stopped.
KMX:⭐ triggered short, +2.51%, T1 met and runners stopped.
An extremely challenging week for swing traders looking for a directional move. Most of these names are still in or near their IBB and are still primed to move but with major indexes also broadly sideways, we just didn’t have the right conditions to stack big winners like prior weeks.
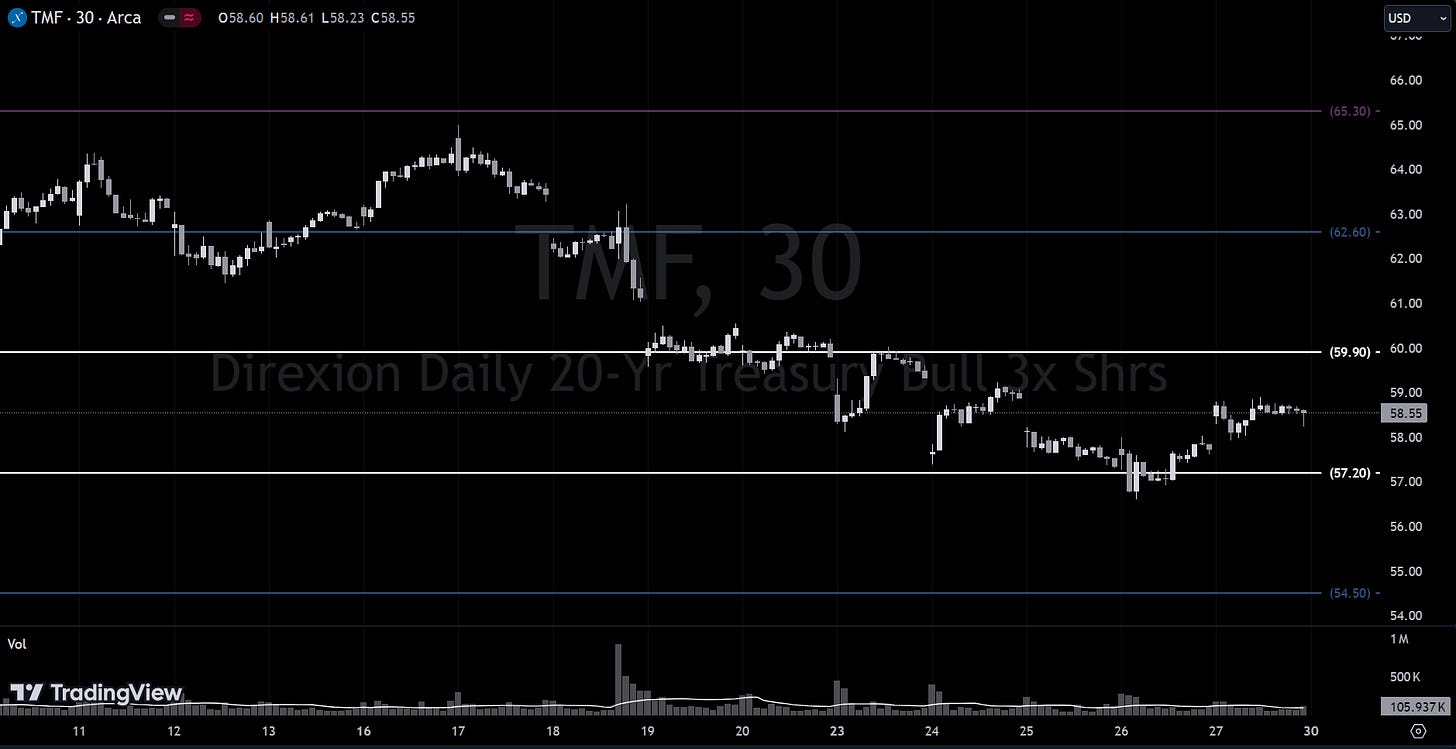
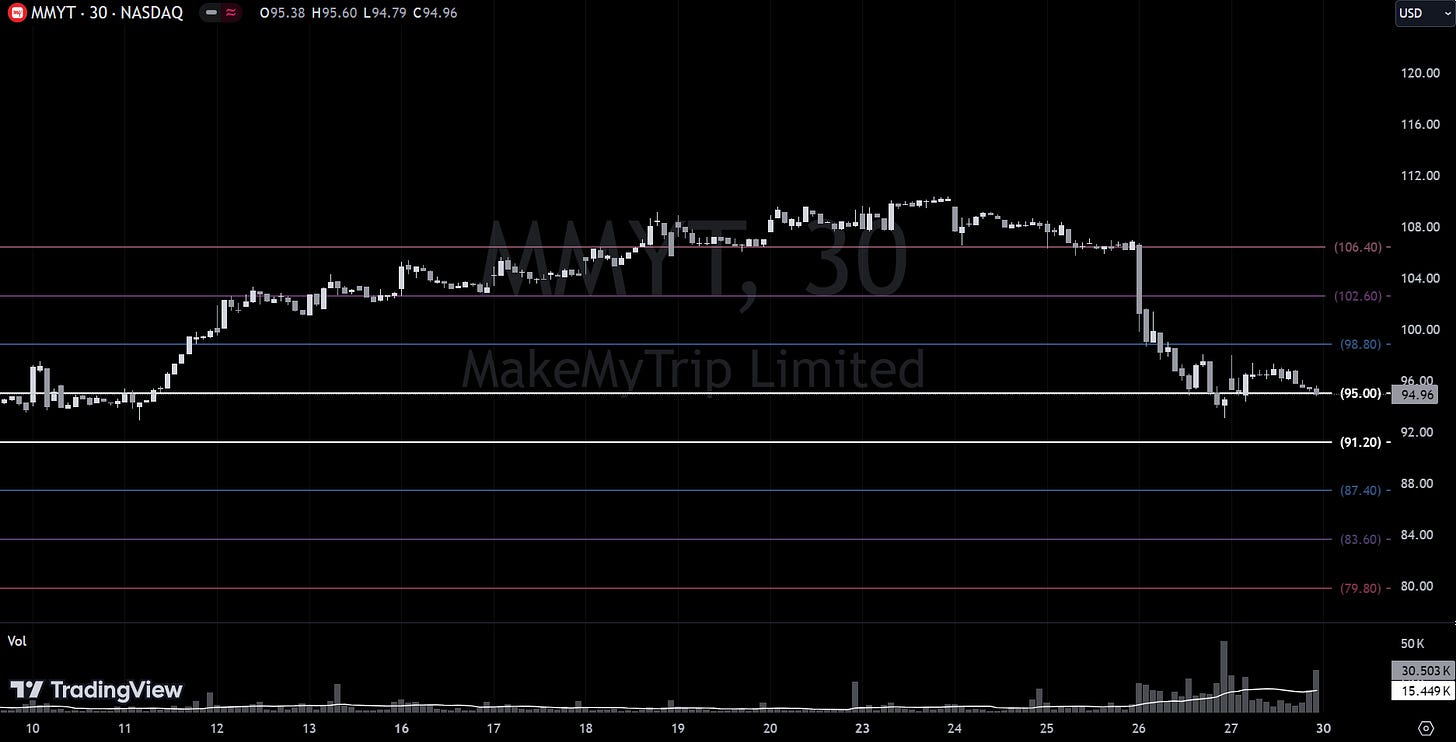
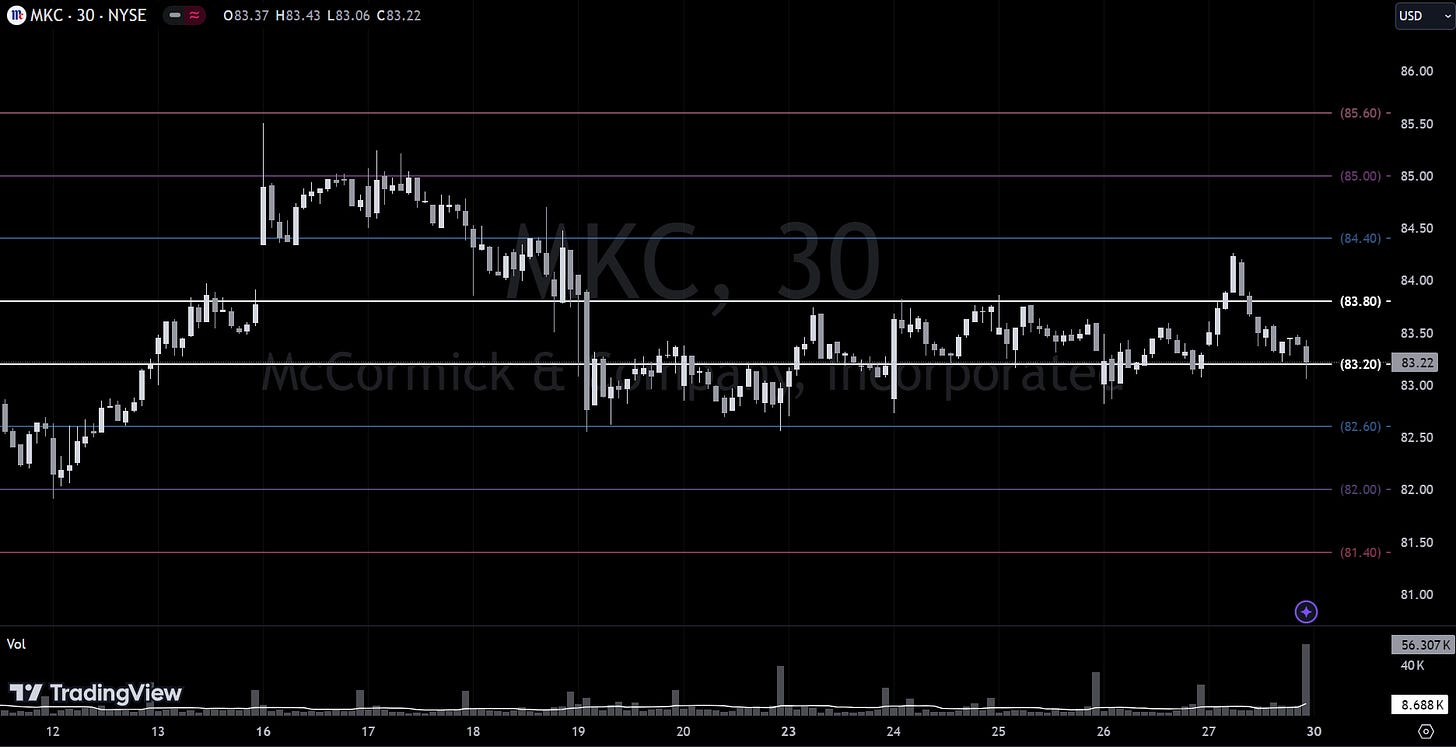
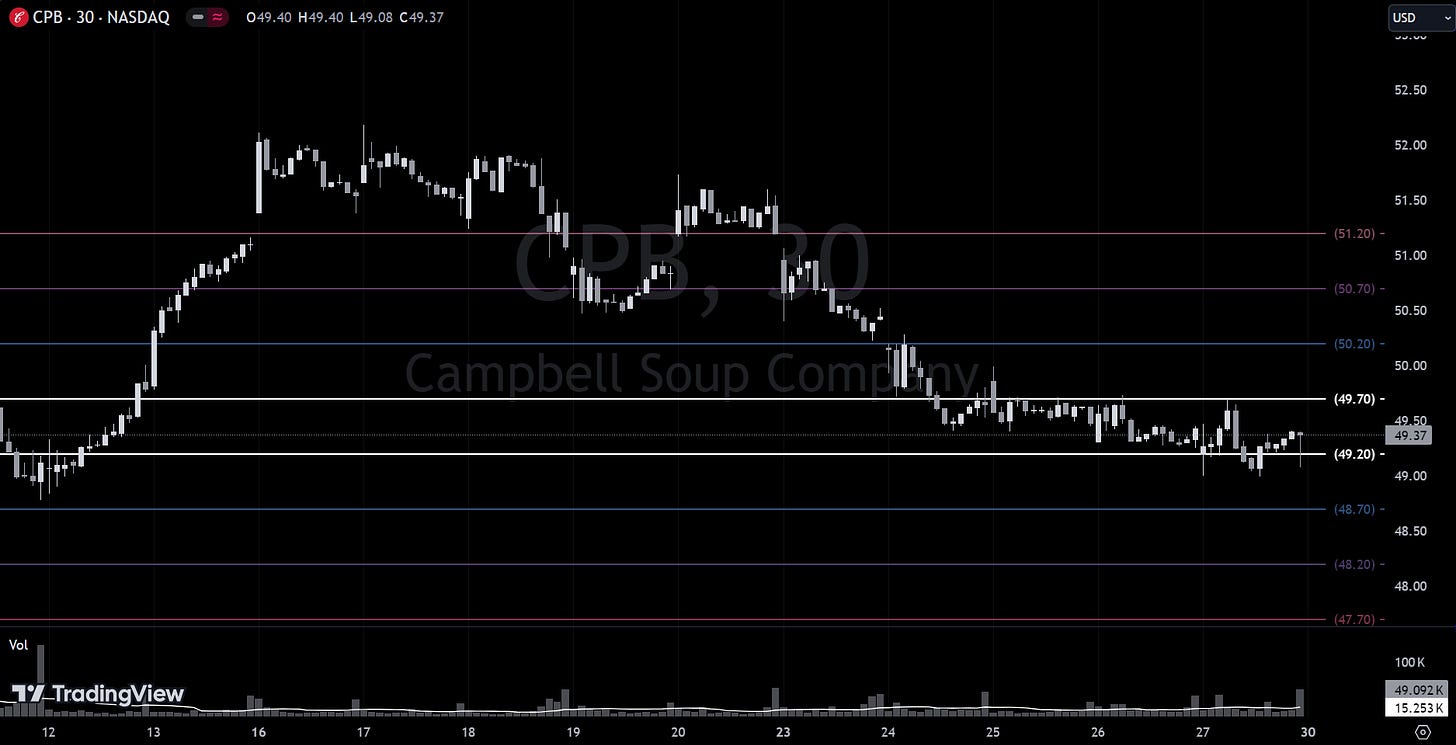
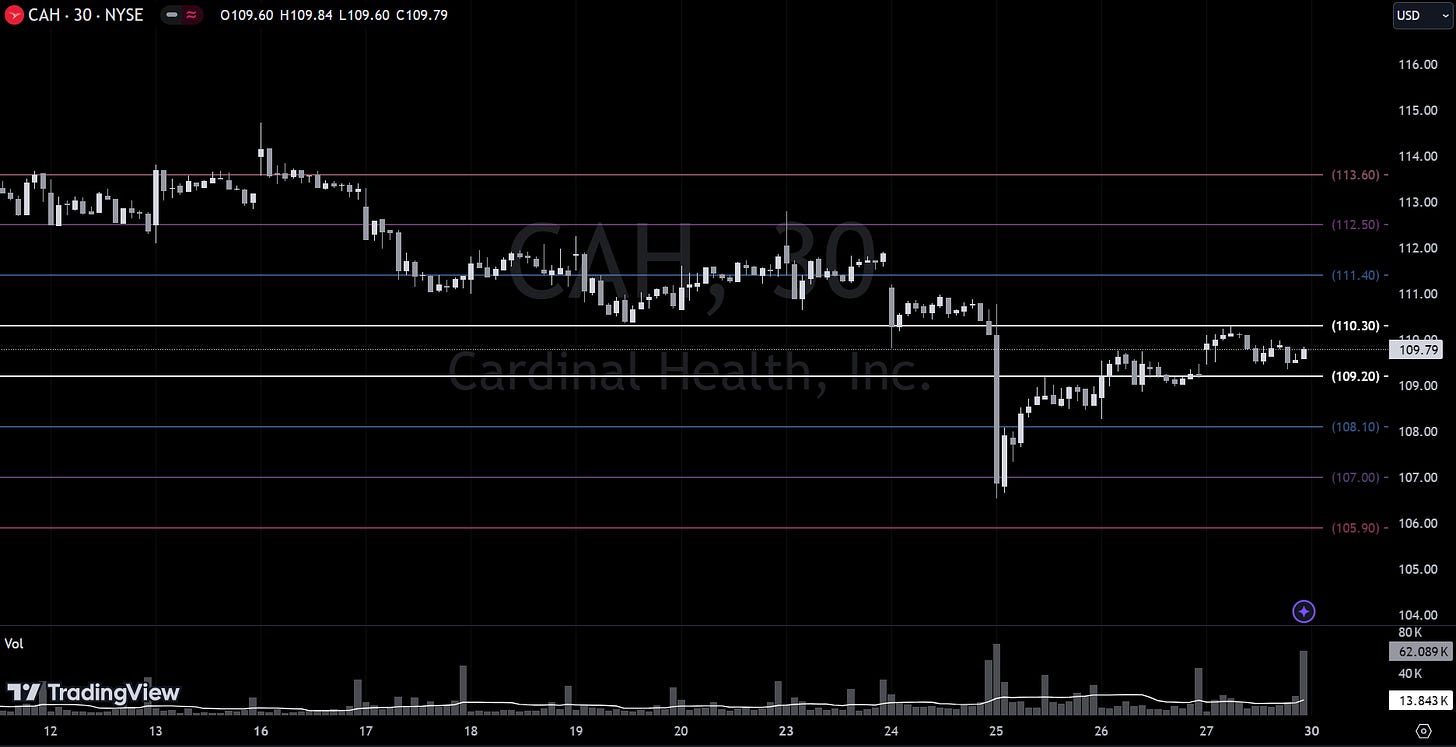
Here are some of the Precision Swings we’re watching this week:
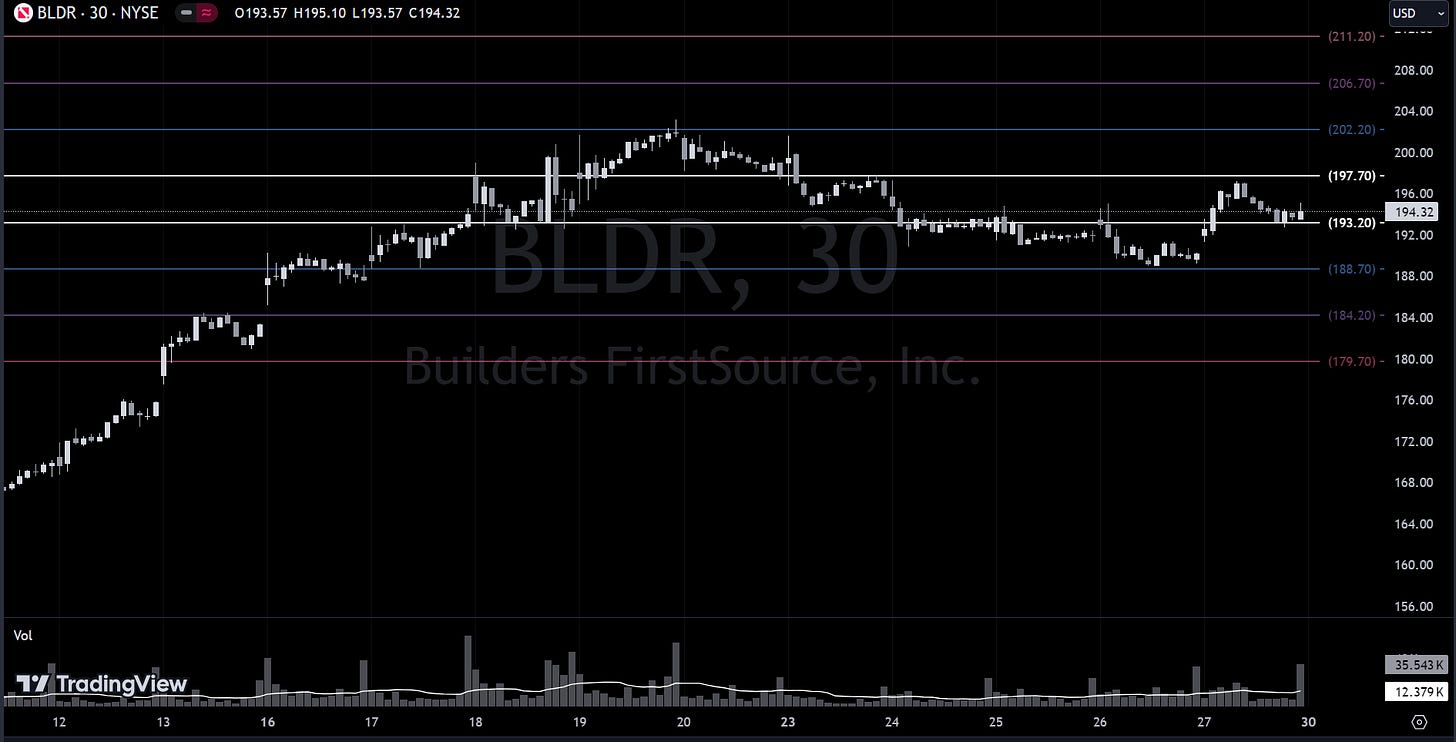
This is up 20% since when it last setup in a prior stack. It’s setting up for another good move.
Institutionally-Backed Gainers & Losers
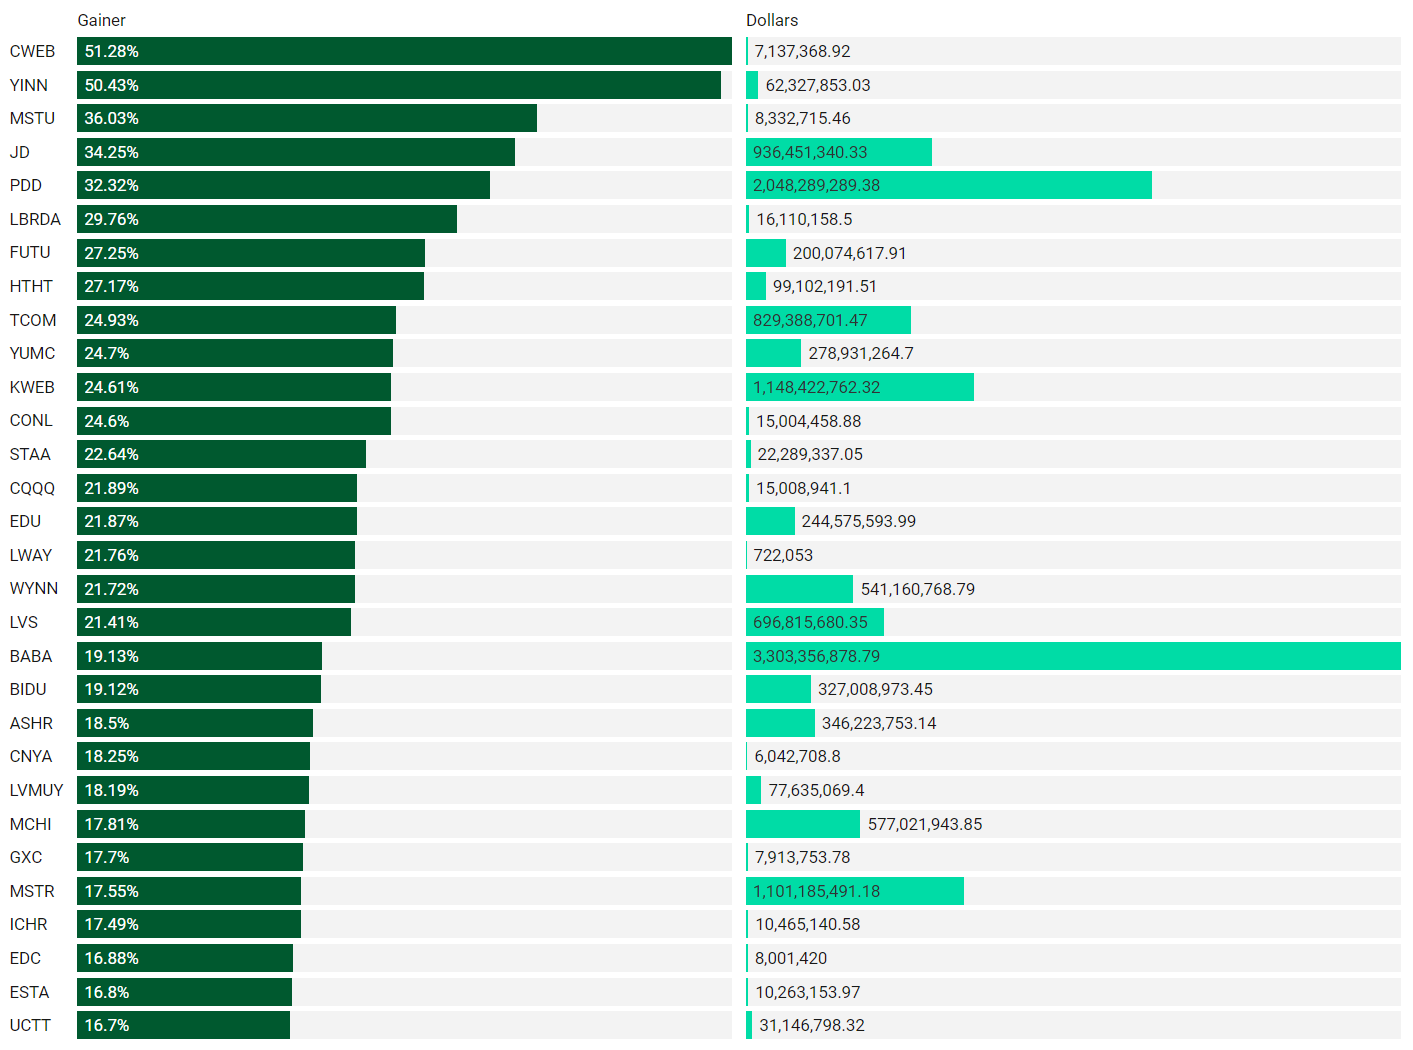
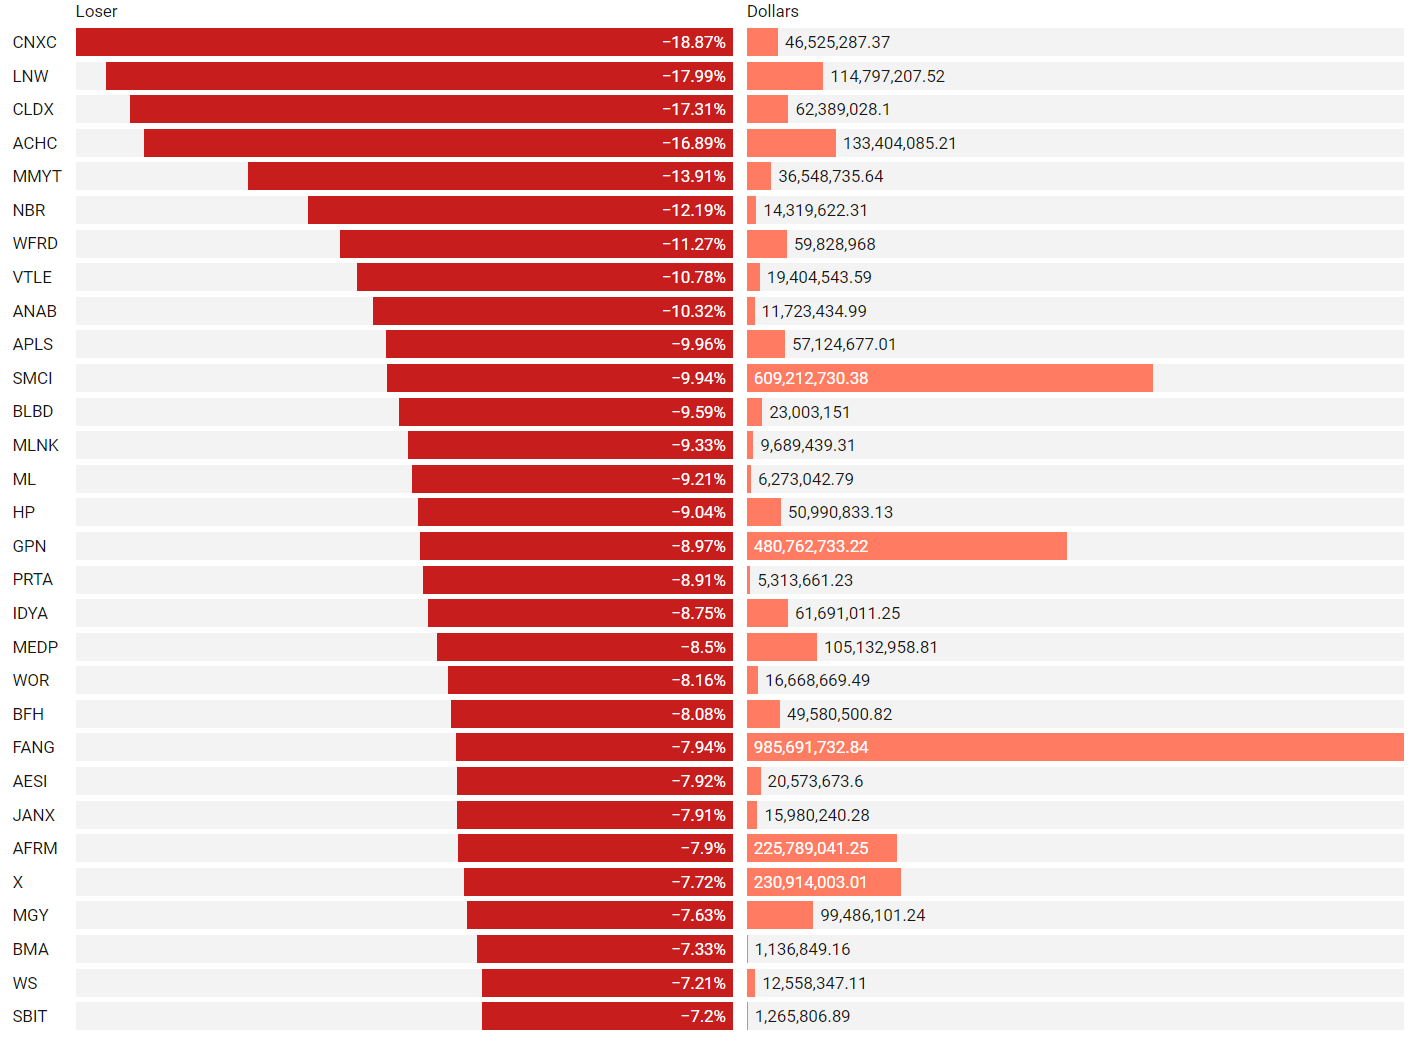
If you’re going to bet on a horse, consider one that is officially endorsed by an institution! These are the top percent gainers (green) and percent losers (red) from this week’s open-to-close that had a trade price greater than $20 and institutional involvement. Continue watching tickers from prior stacks as these frequently turn into multi-leg trades with a lot of movement!
Top Institutionally Backed Gainers
Top Institutionally Backed Losers
Billionaire Boys Club
Tickers that printed a trade worth at least $1B last week get a special shout-out… Welcome to the club. Subs should login to VolumeLeaders.com to get the exact trade price and relevant institutional levels around the trade - these are massive commitments by institutions that should not be ignored.
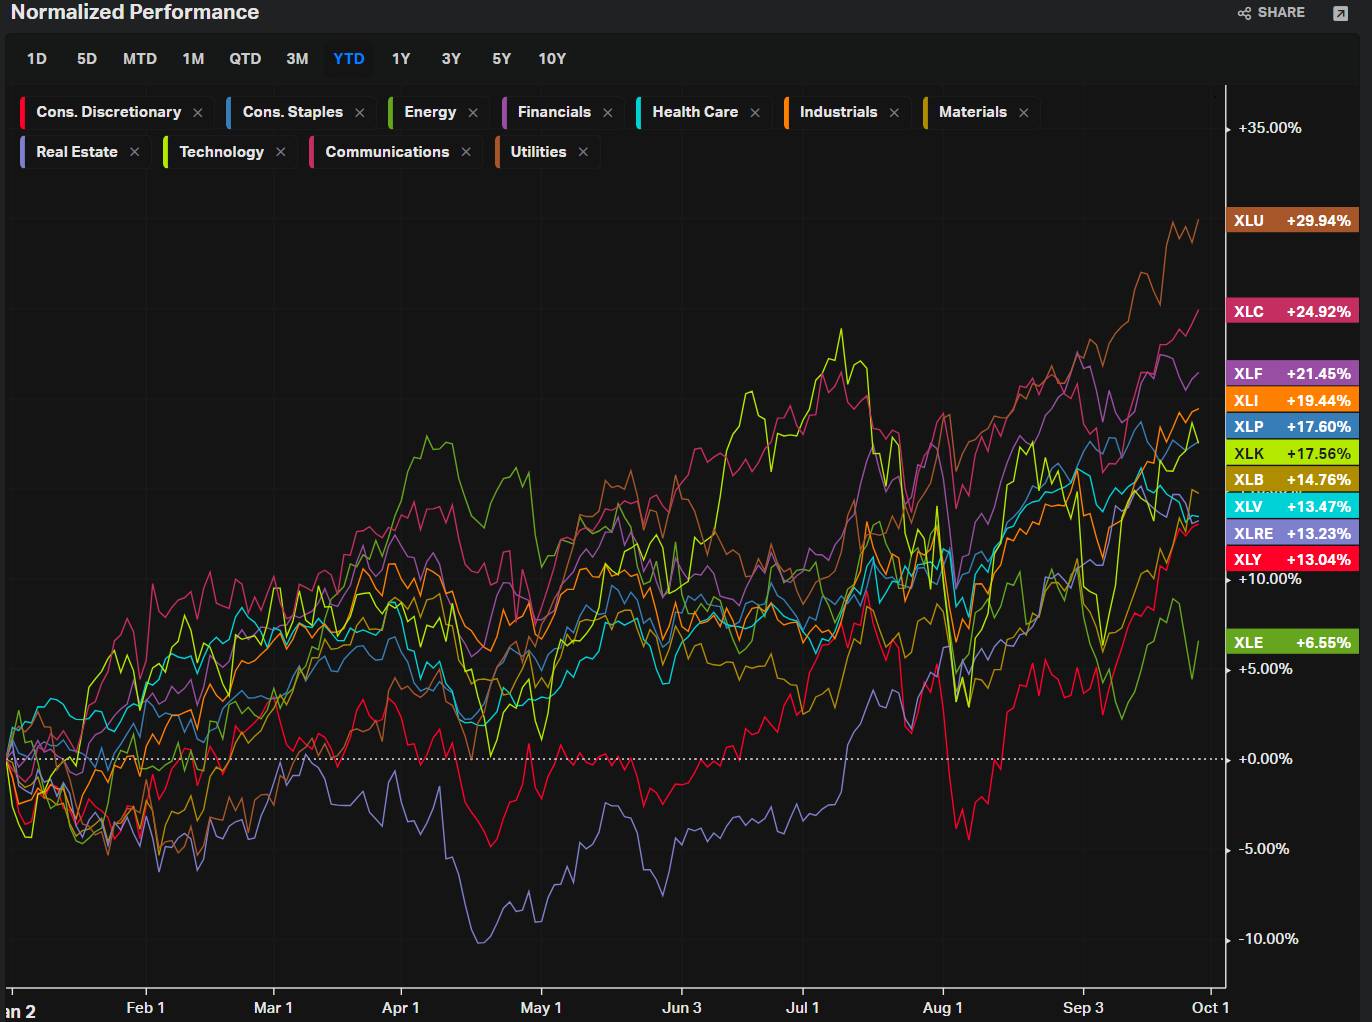
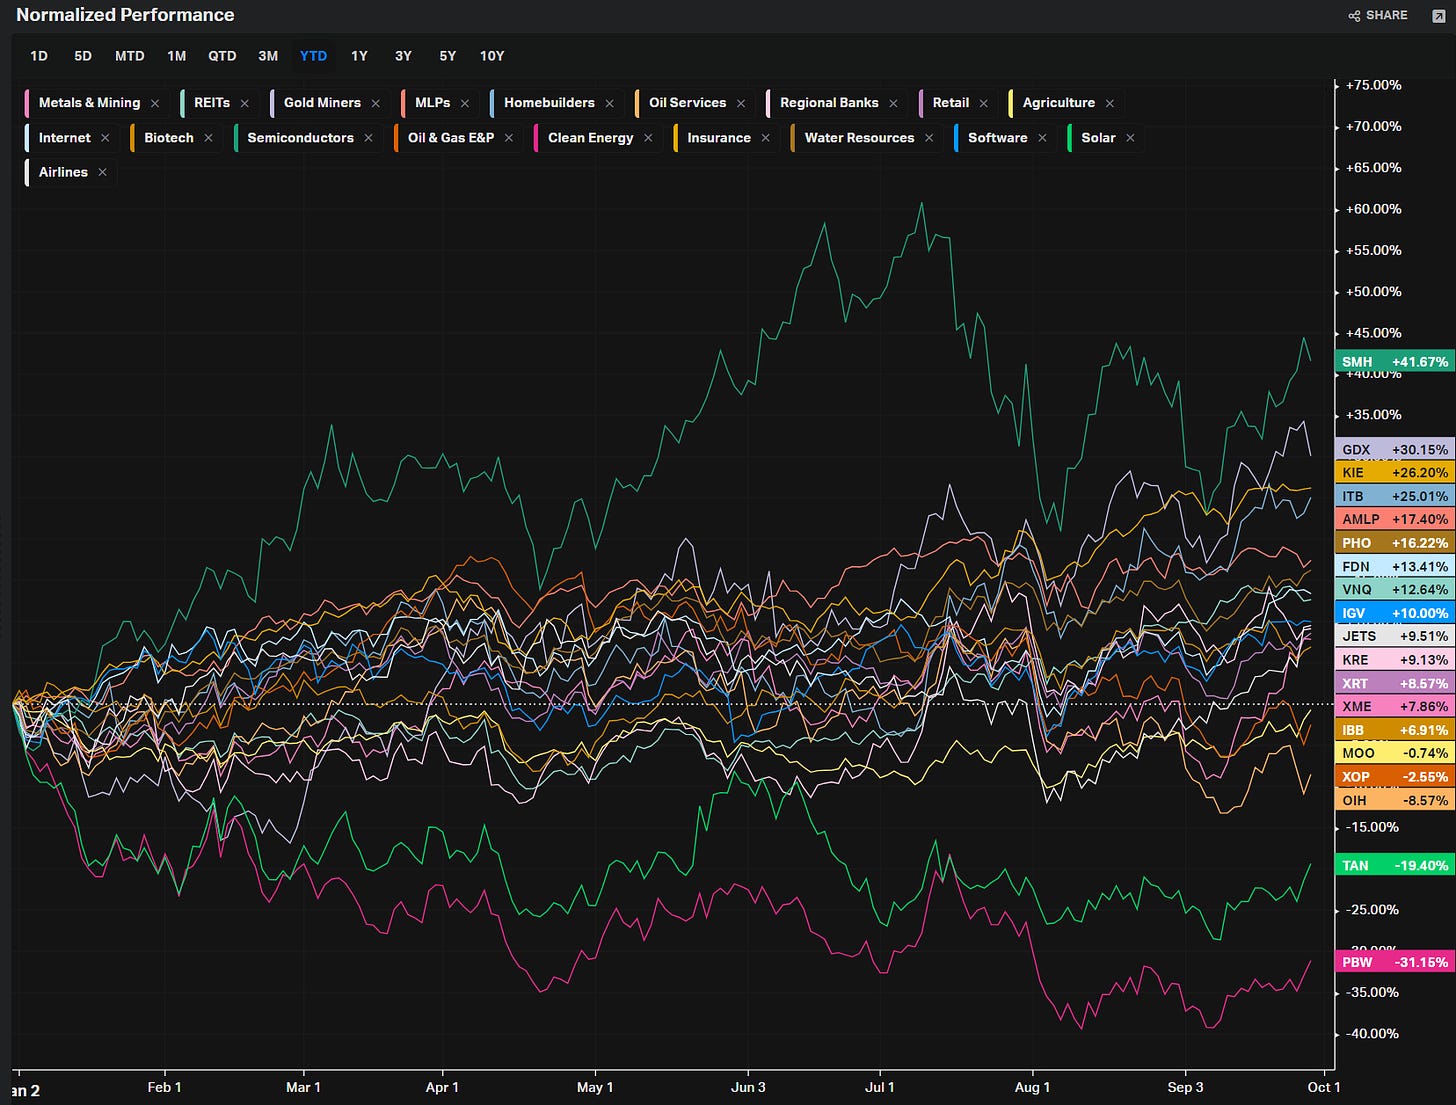
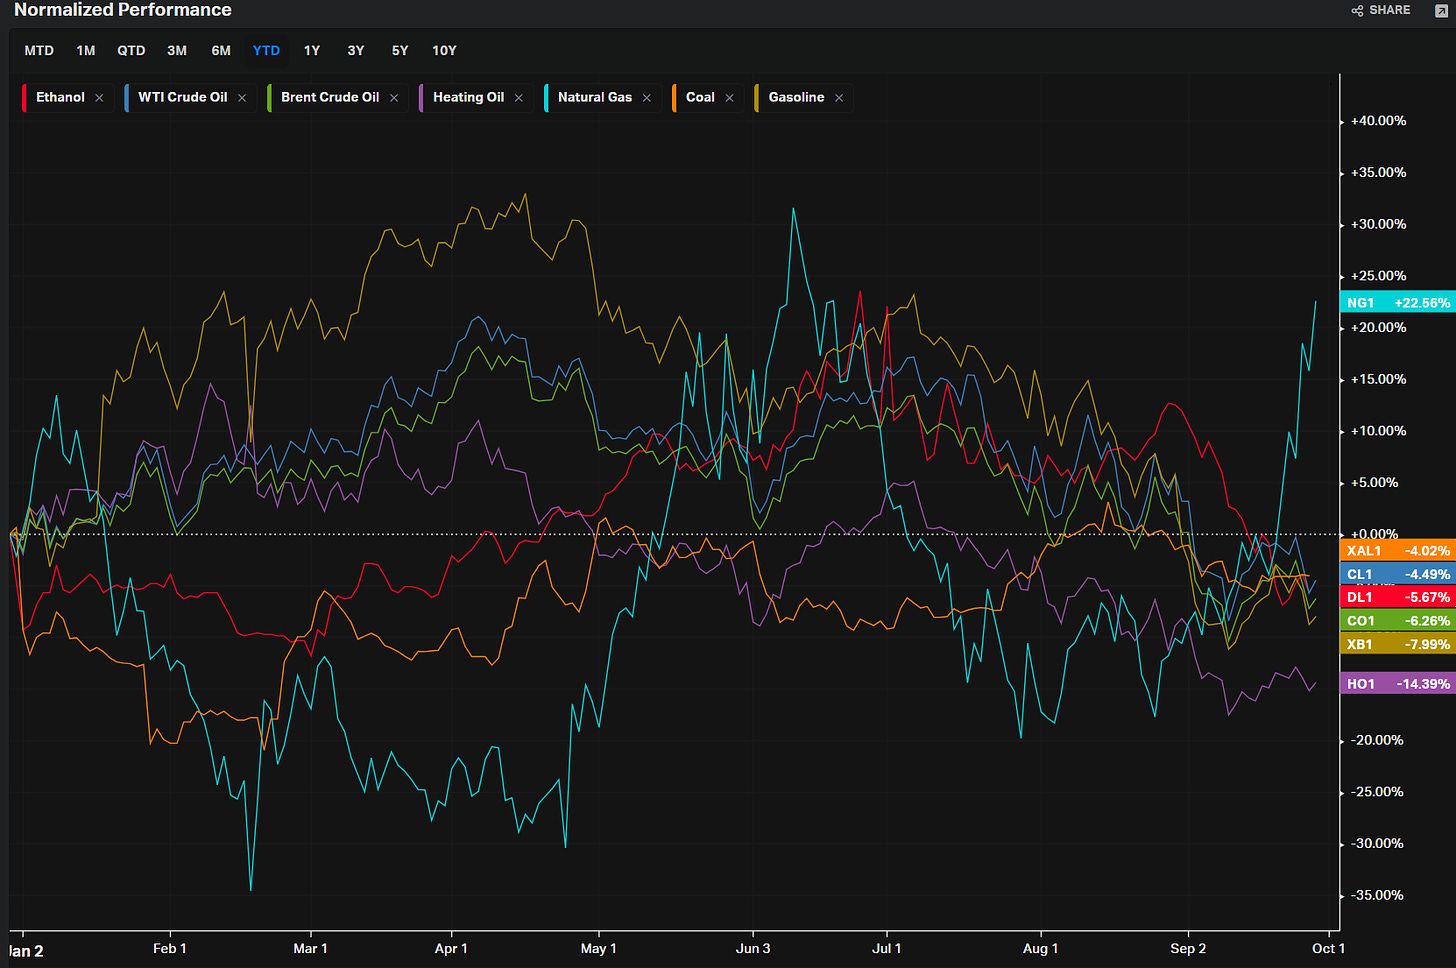
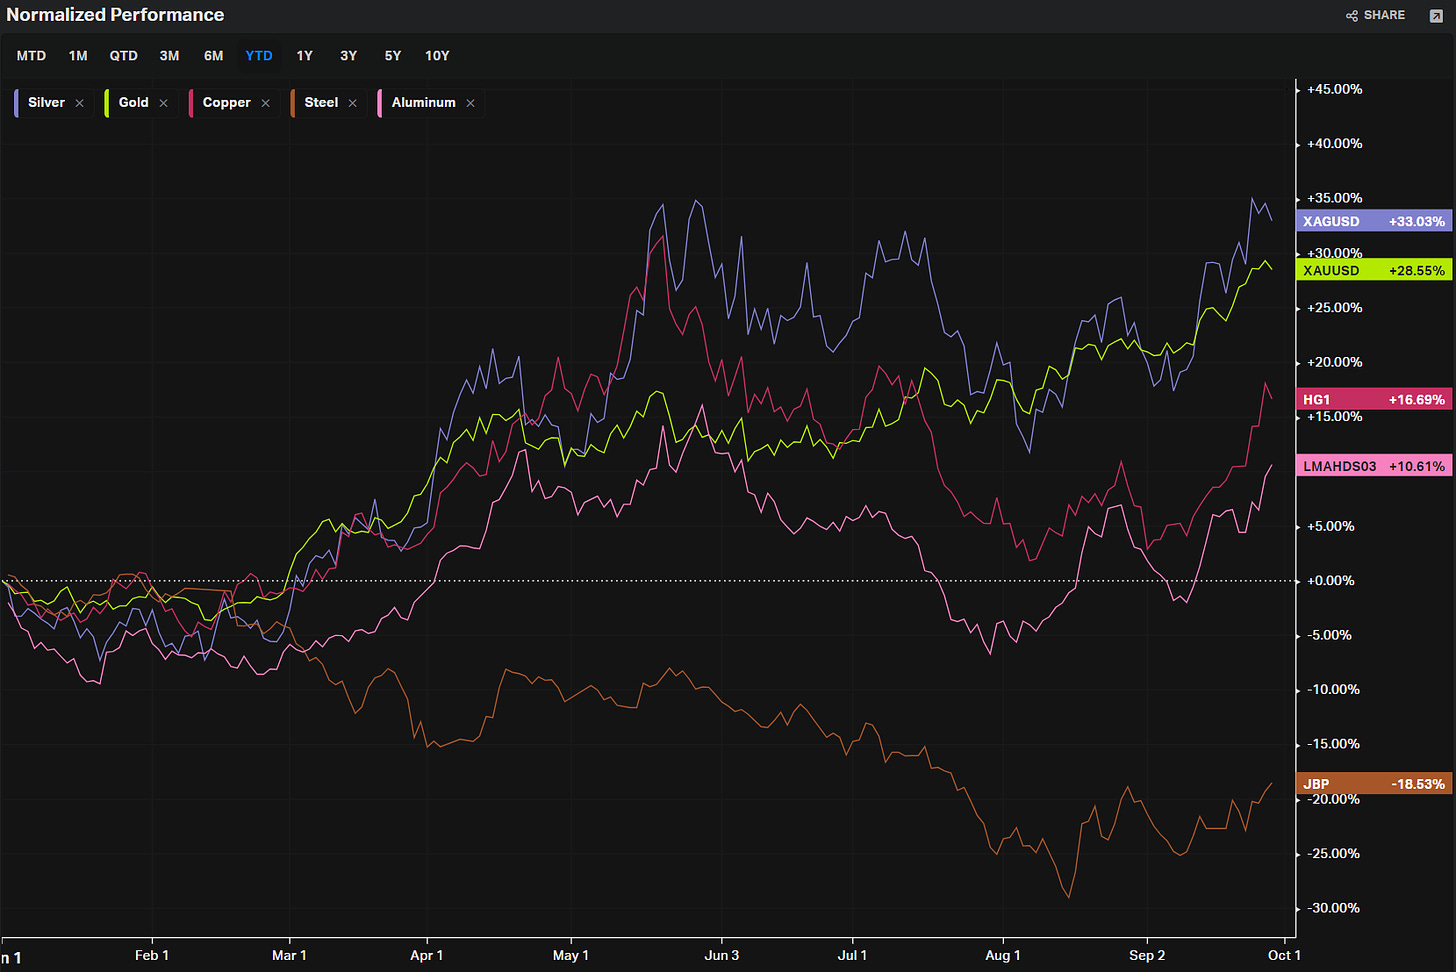
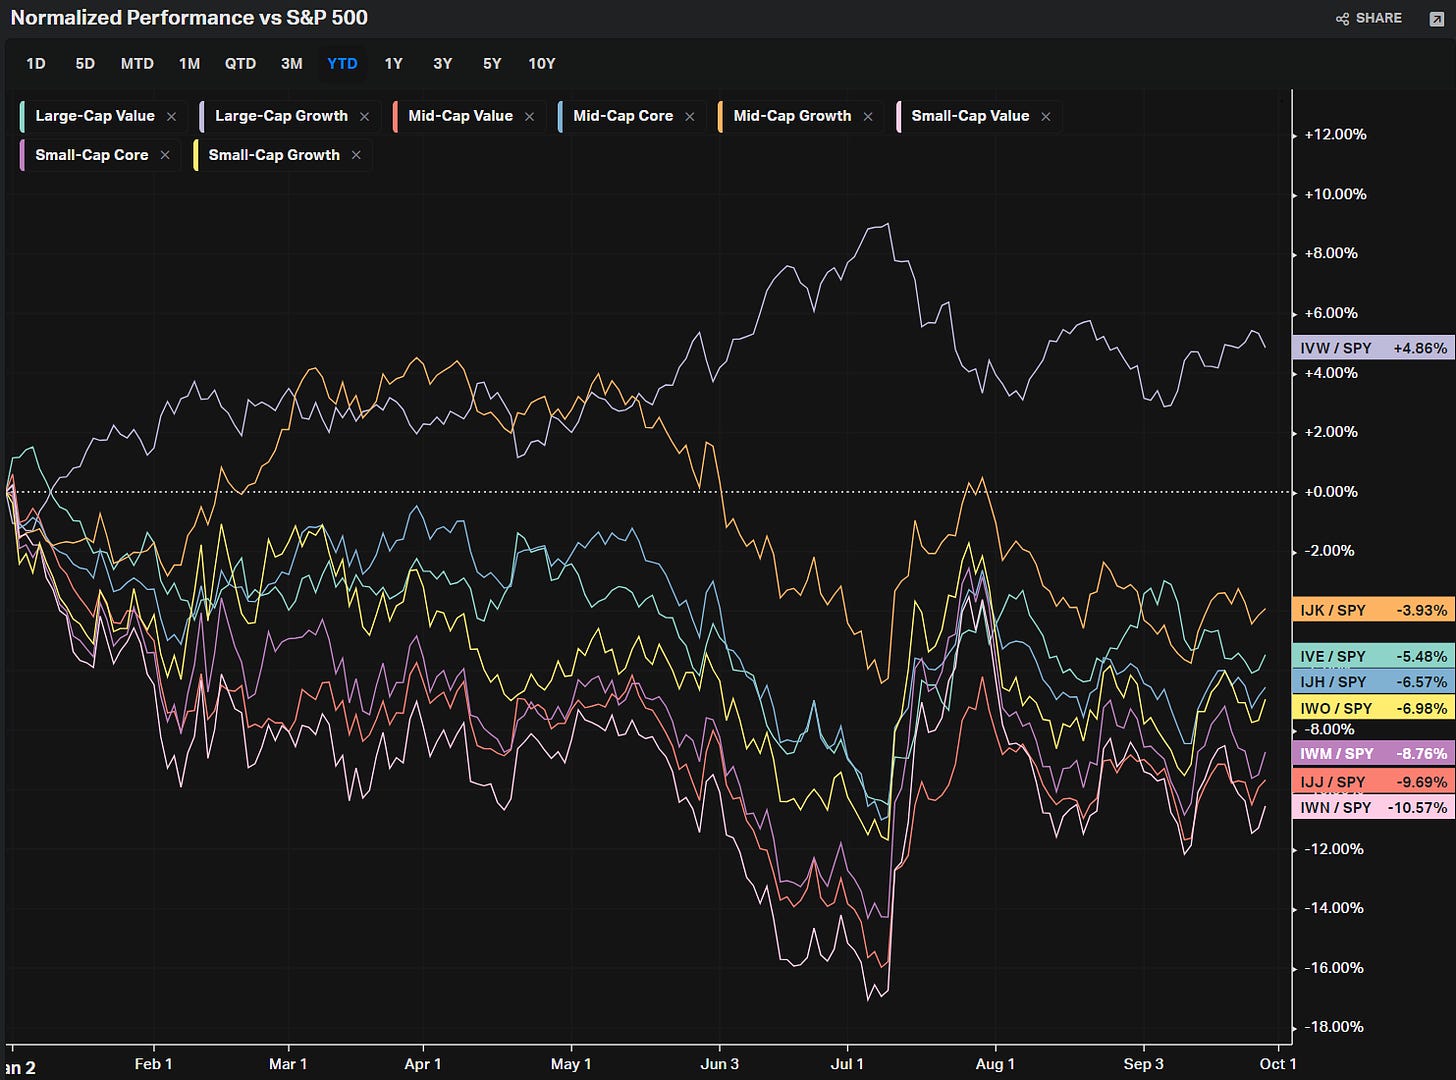
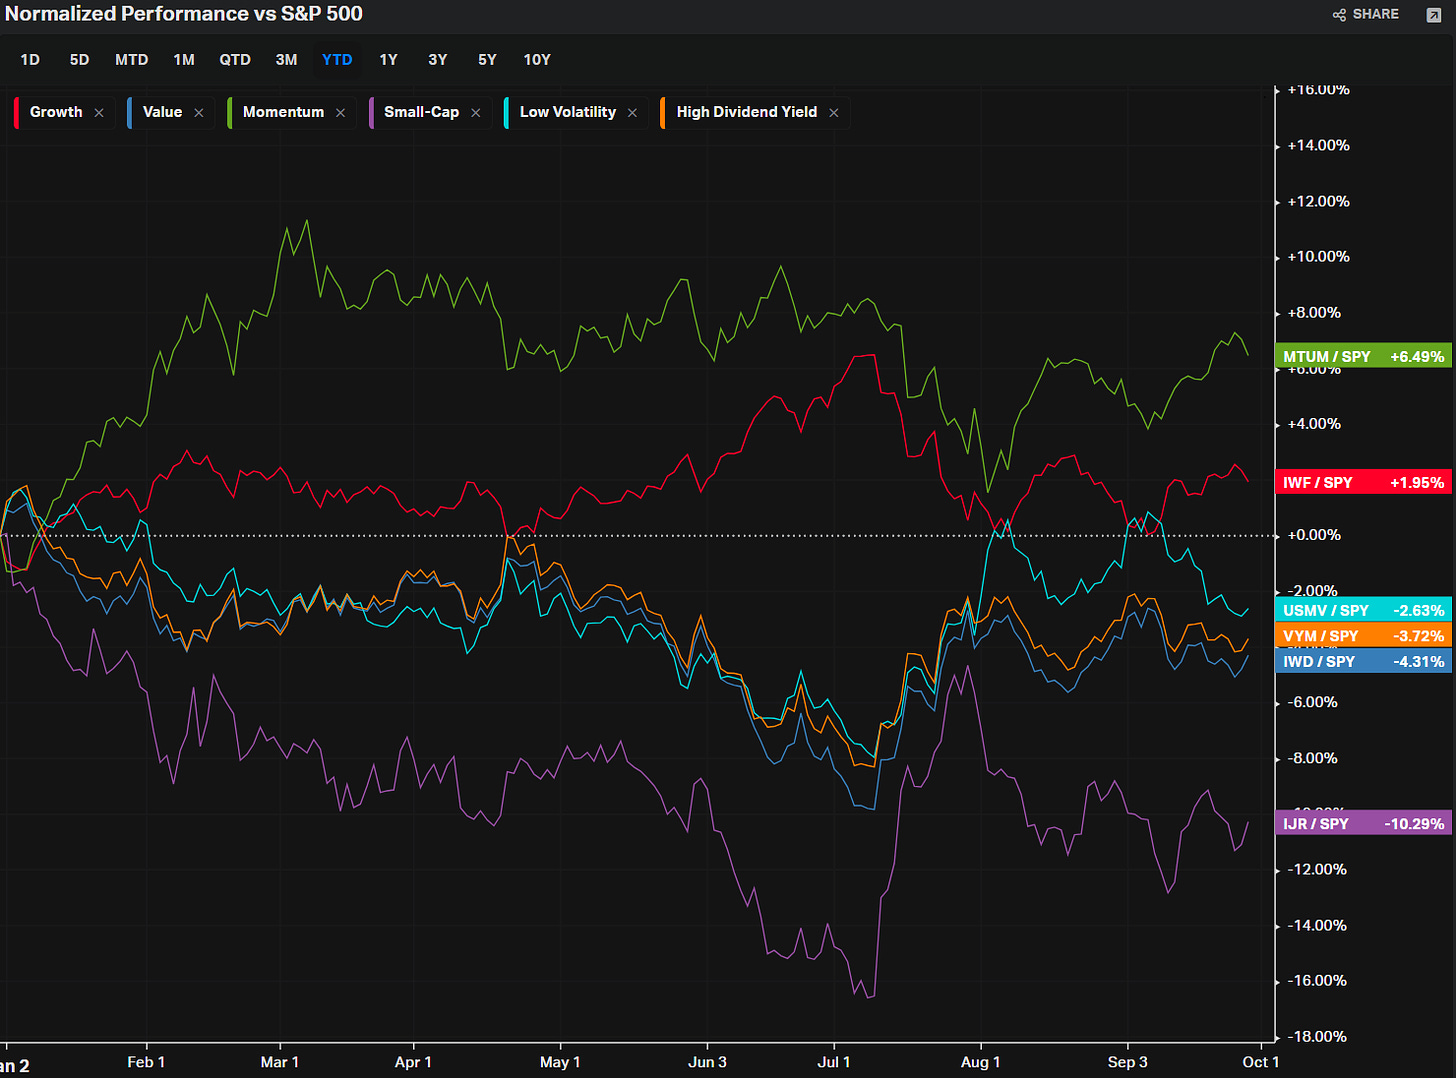
Summary Of Thematic Performance YTD
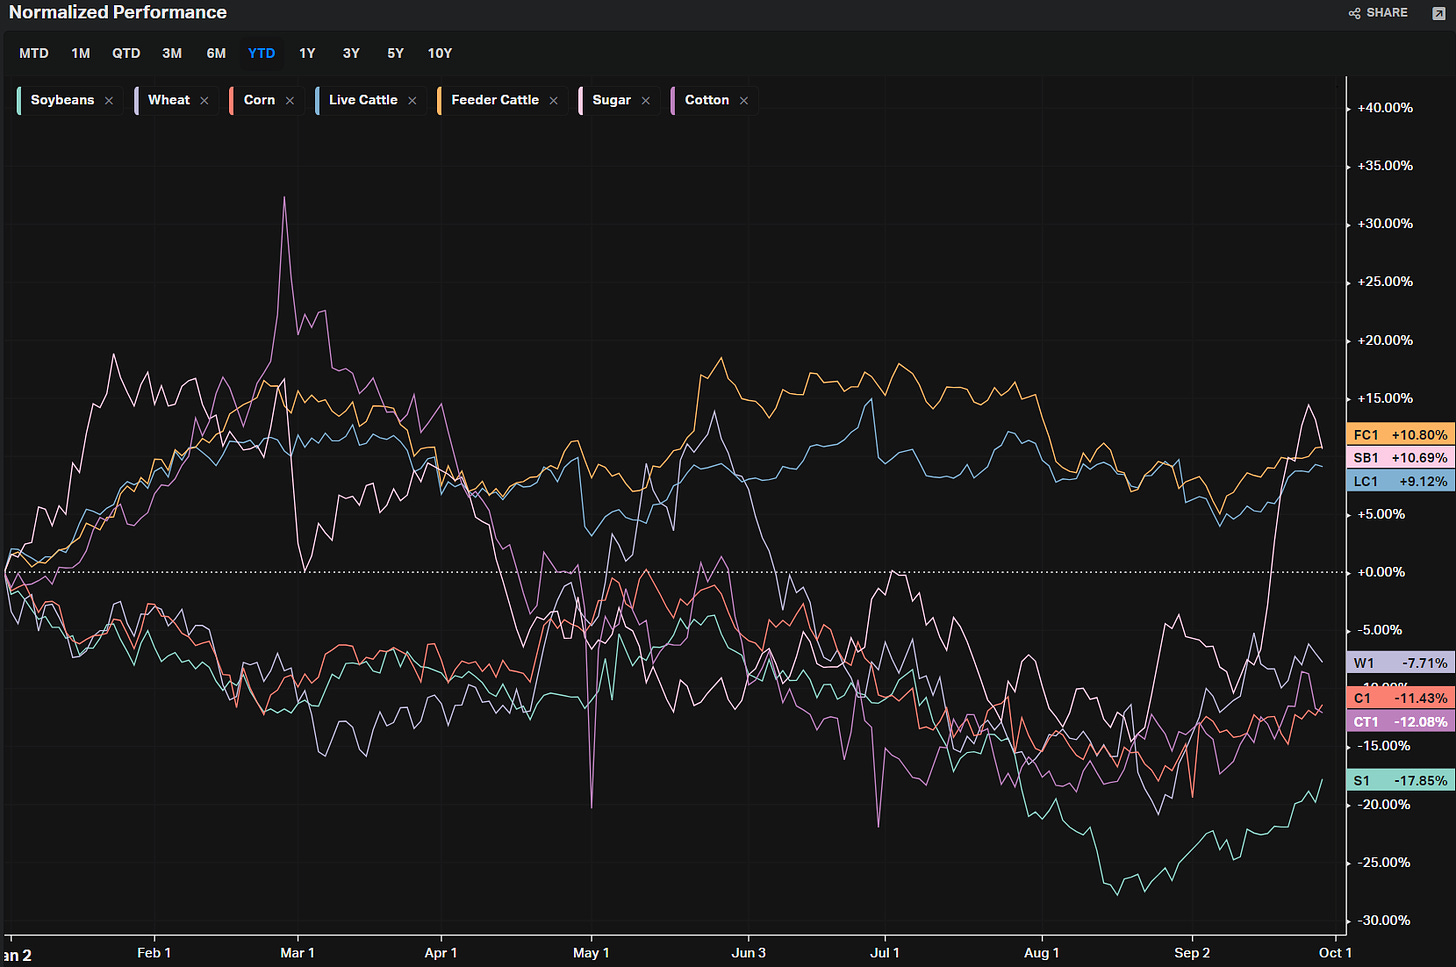
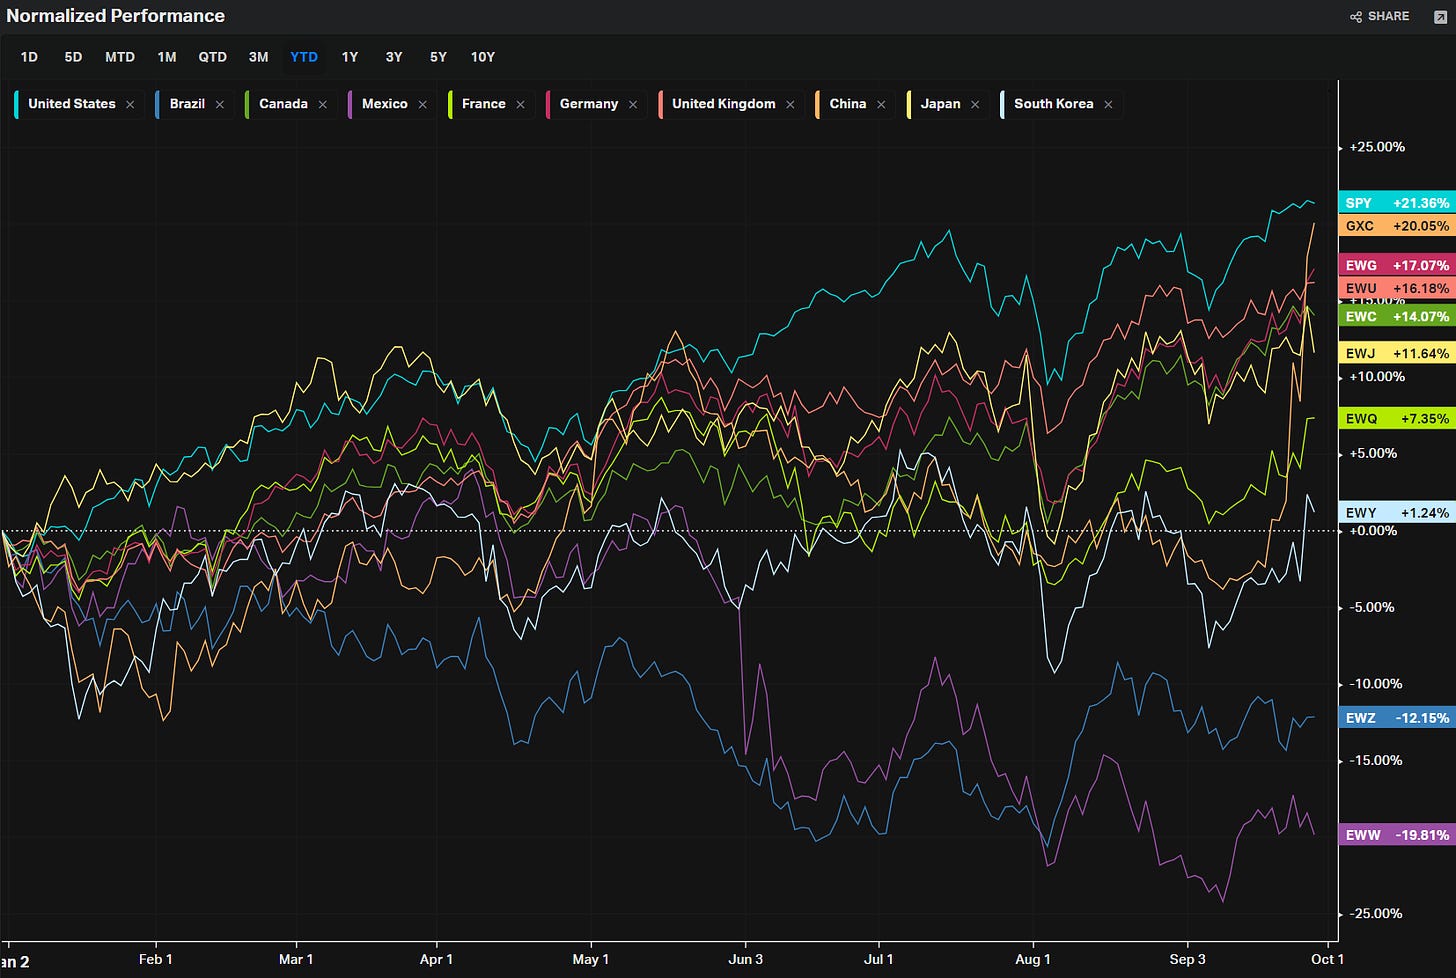
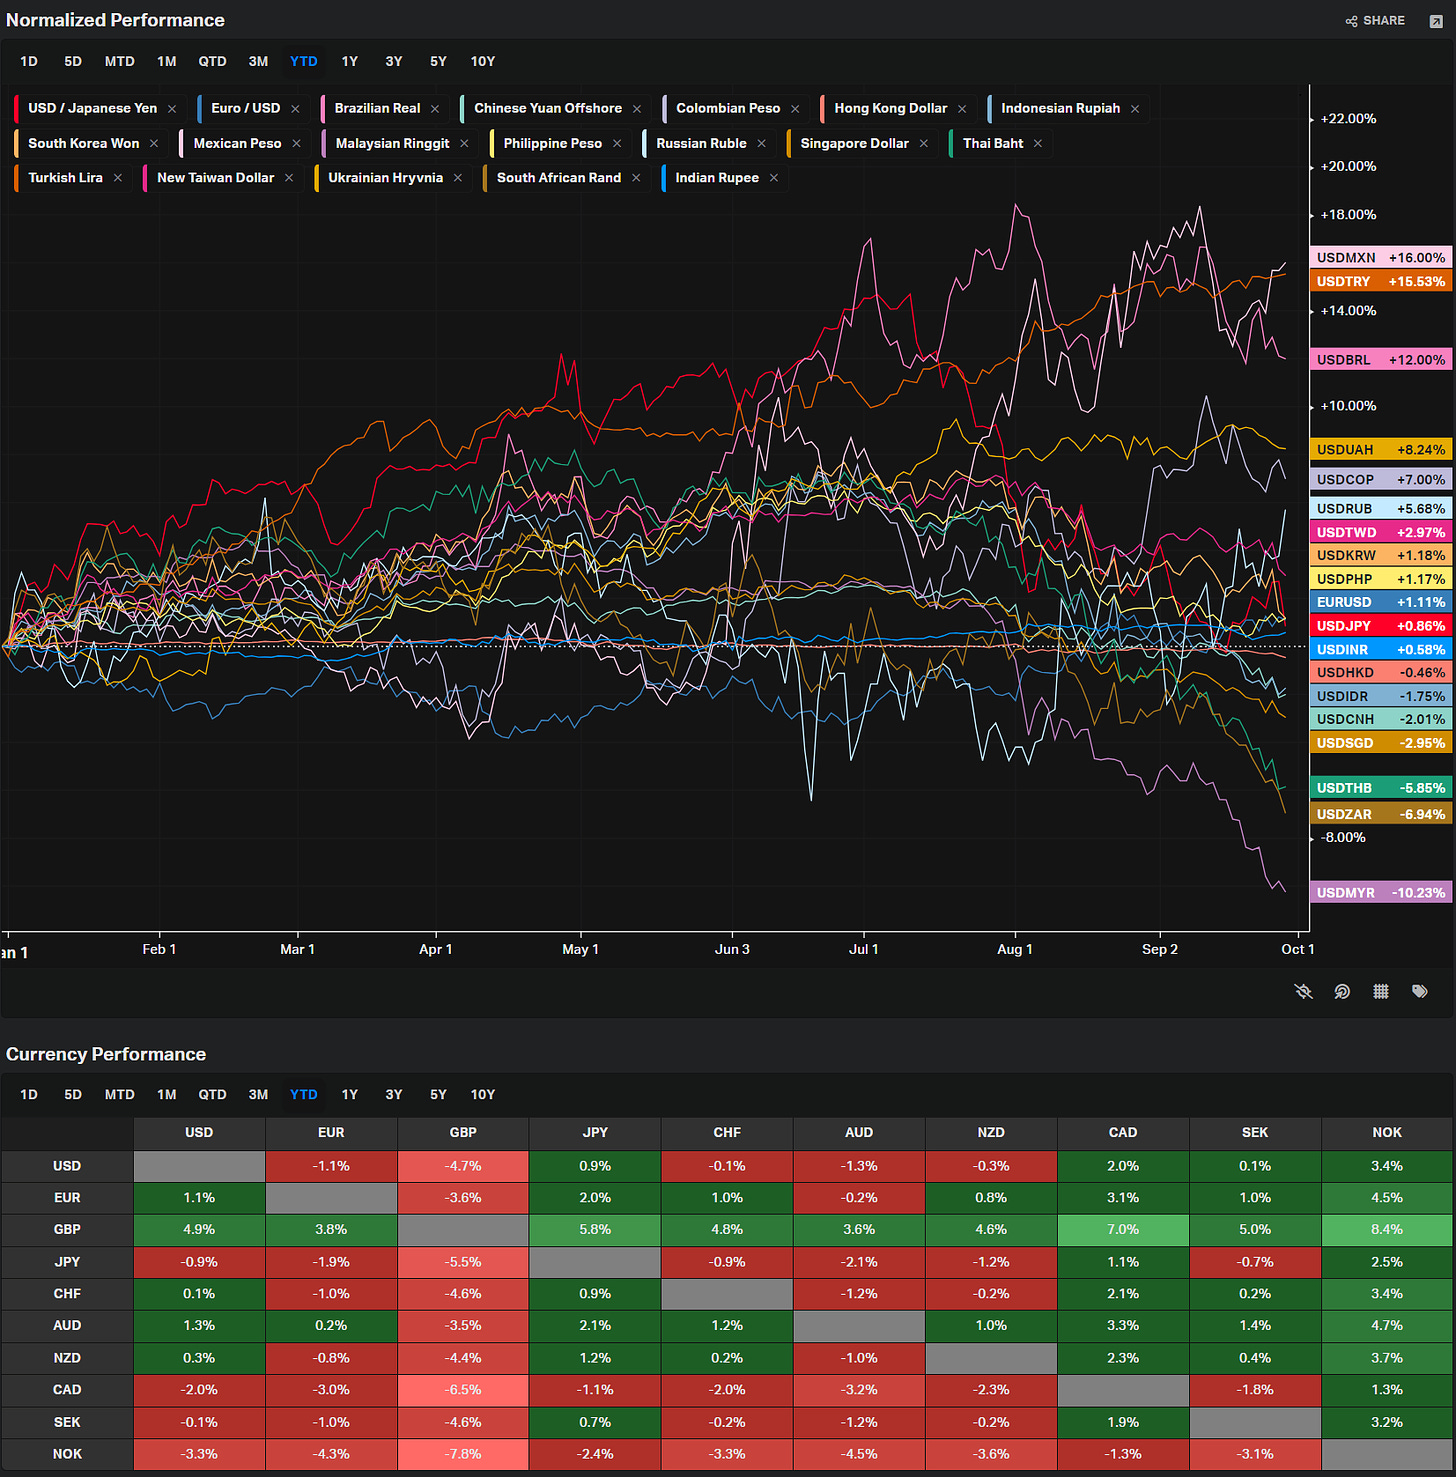
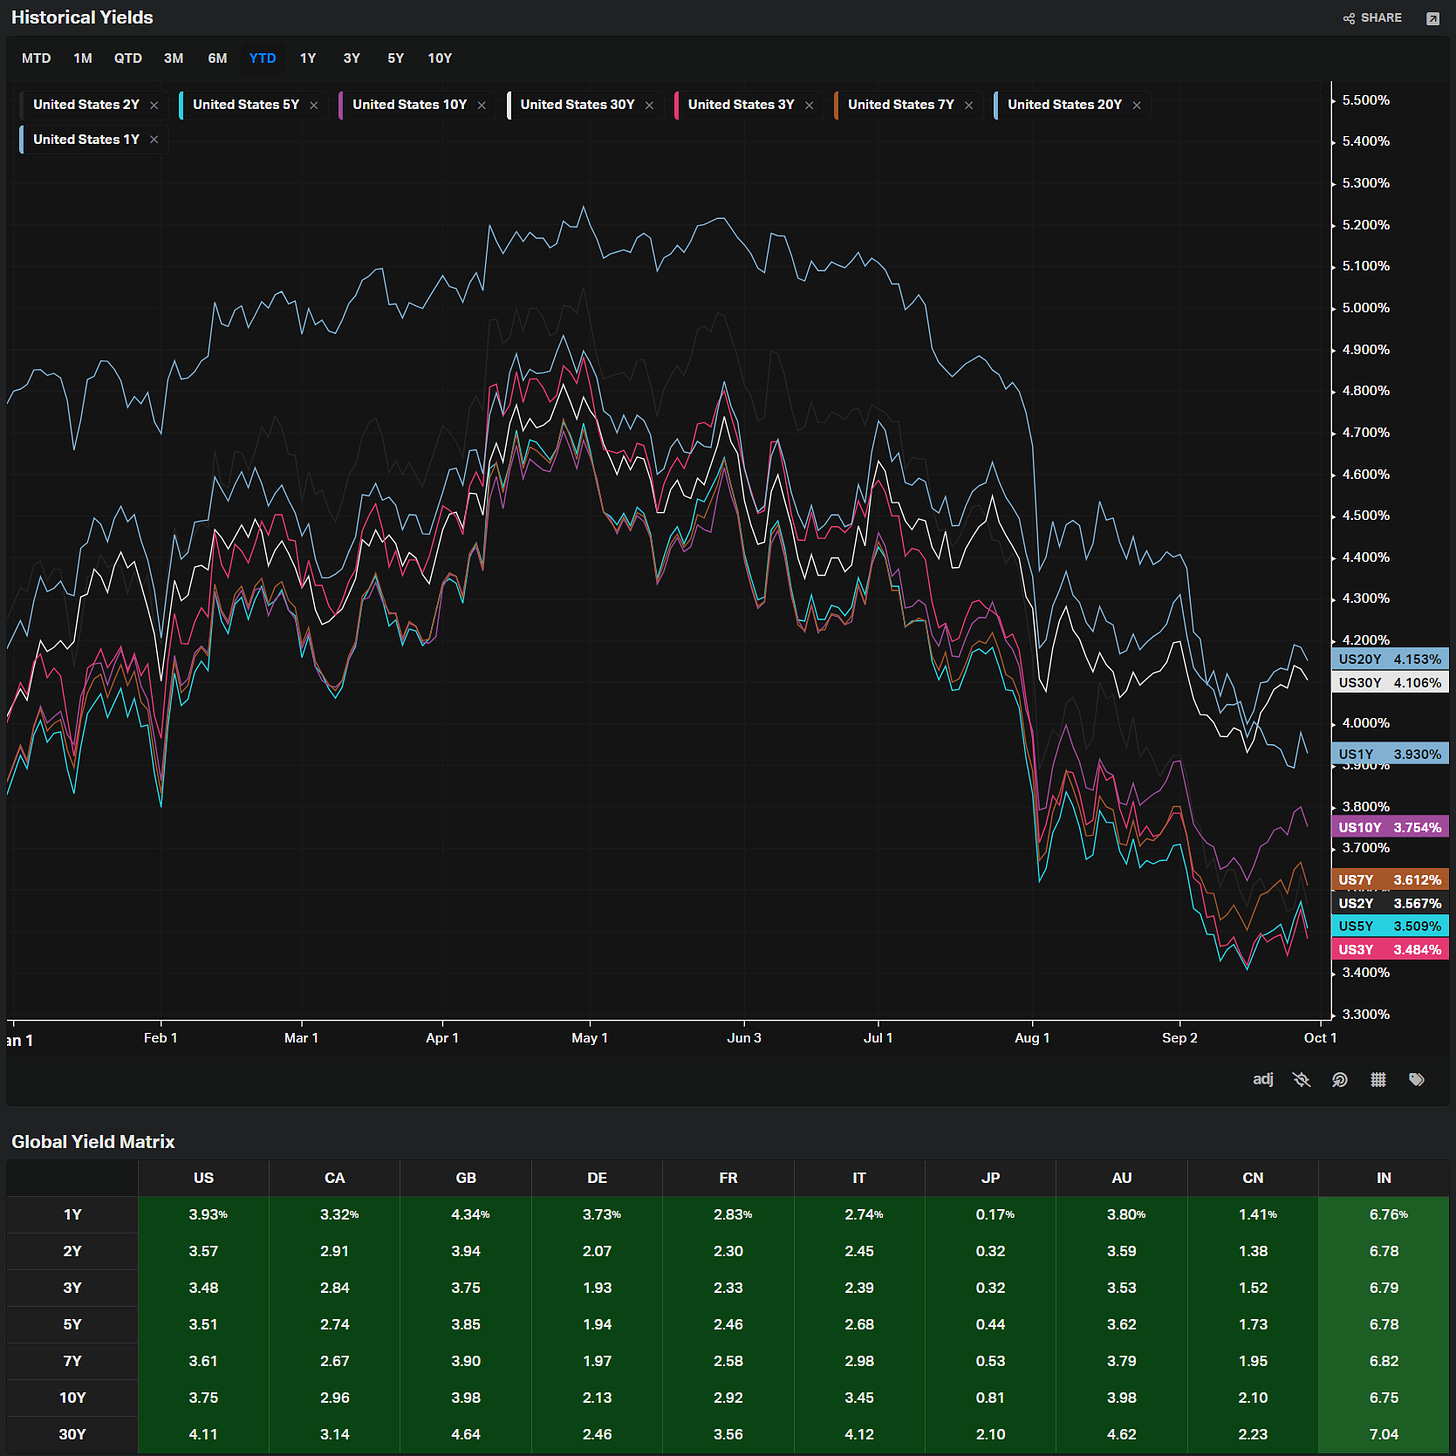
VolumeLeaders.com provides a lot of pre-built filters for thematics so that you can quickly dive into specific areas of the market. These performance overviews are provided here only for inspiration. Consider targeting leaders and/or laggards in the best and worst sectors, for example.
S&P By Sector
S&P By Industry
Energy
Metals
Agriculture
Country ETFs
Currencies
Yields
Factors: Size vs Value
Factors: Style
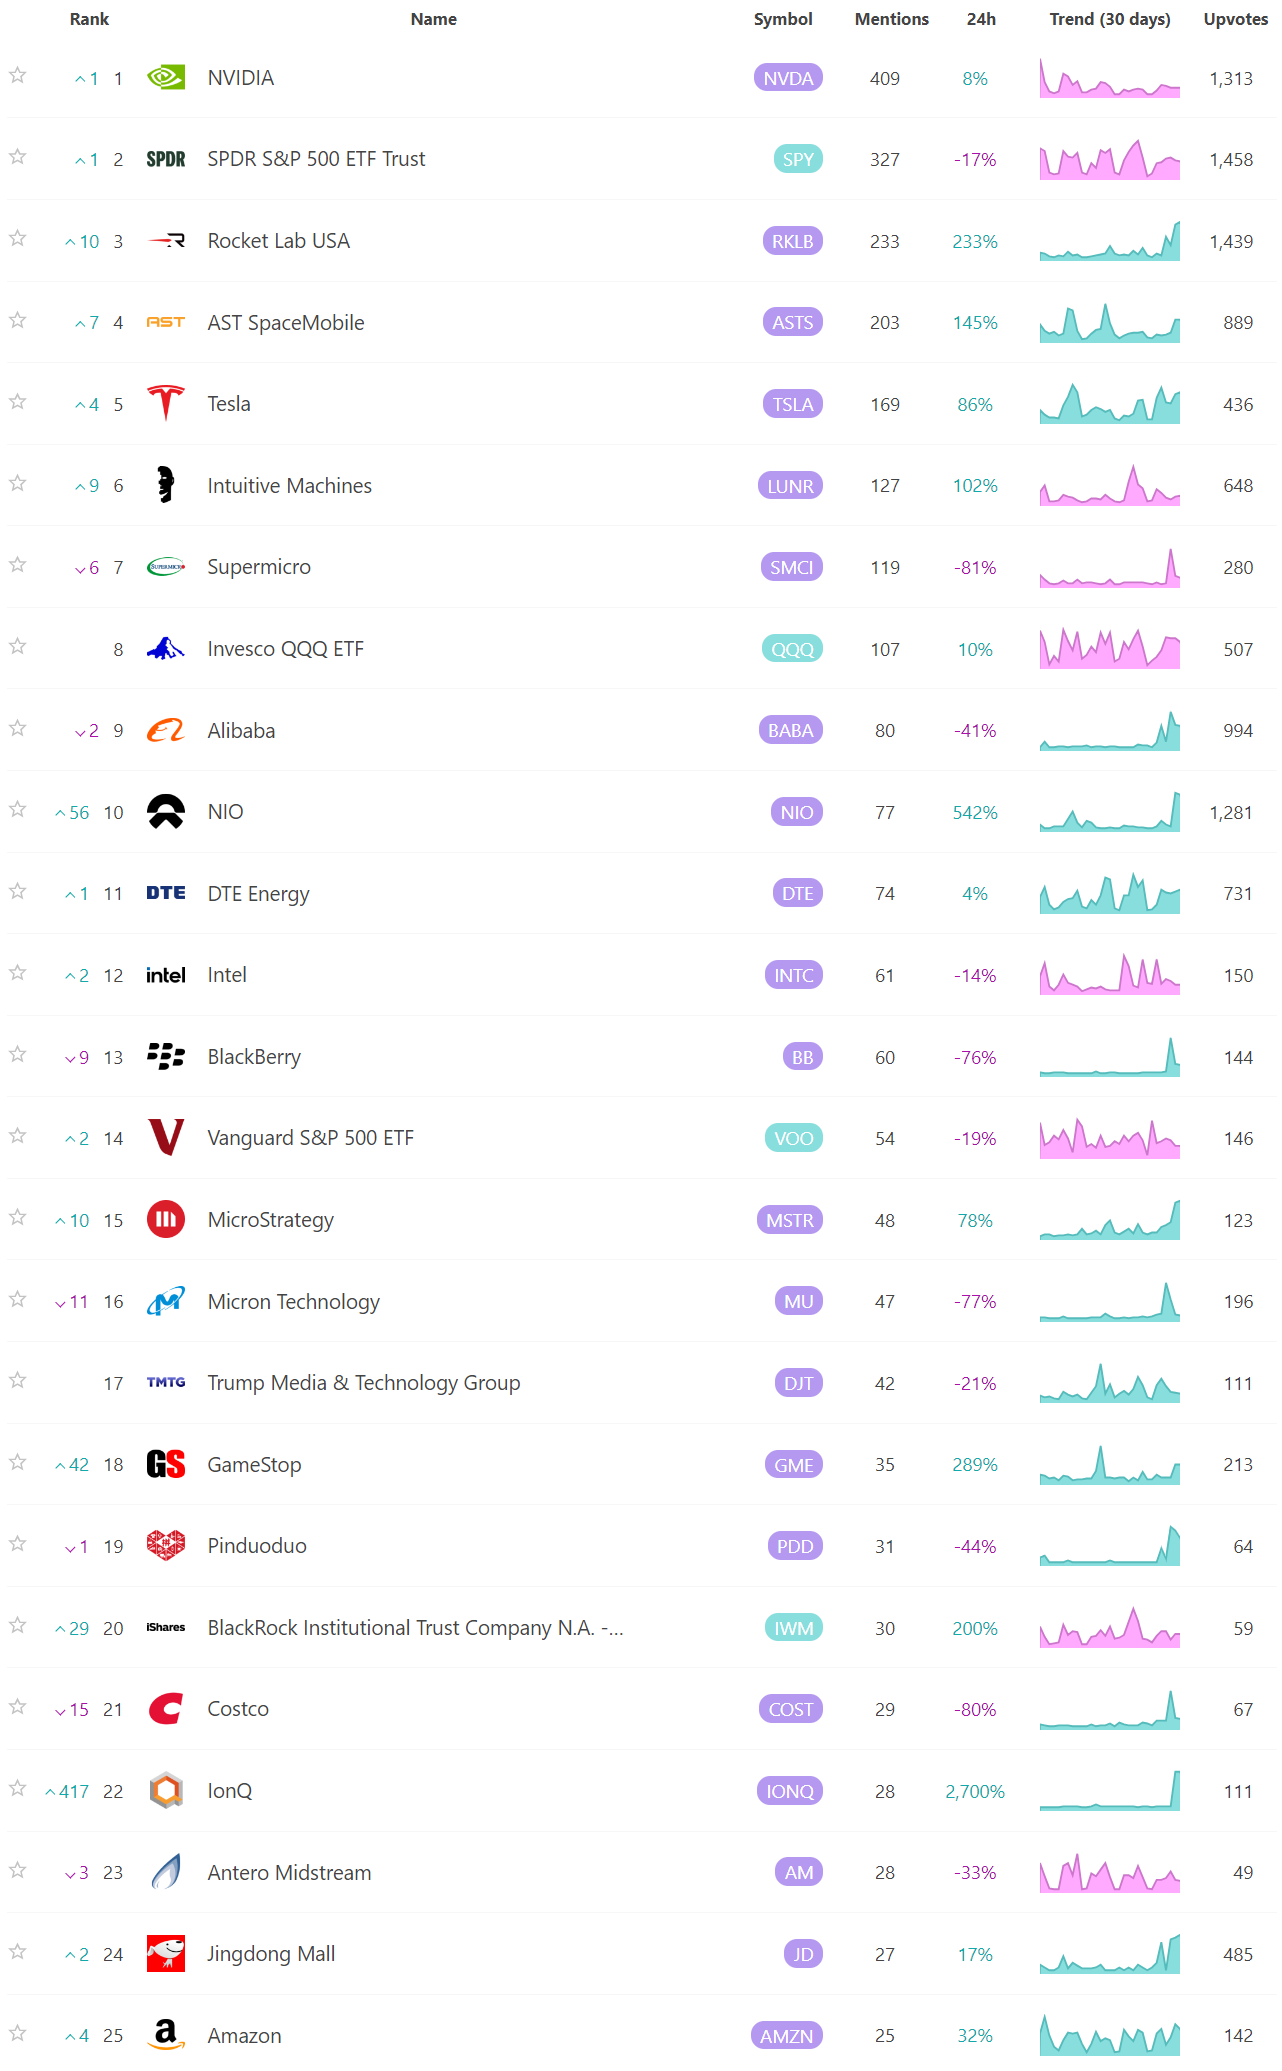
Social Media Favs
Most mentioned/discussed tickers on Reddit from some of the most active Subreddits for trading:
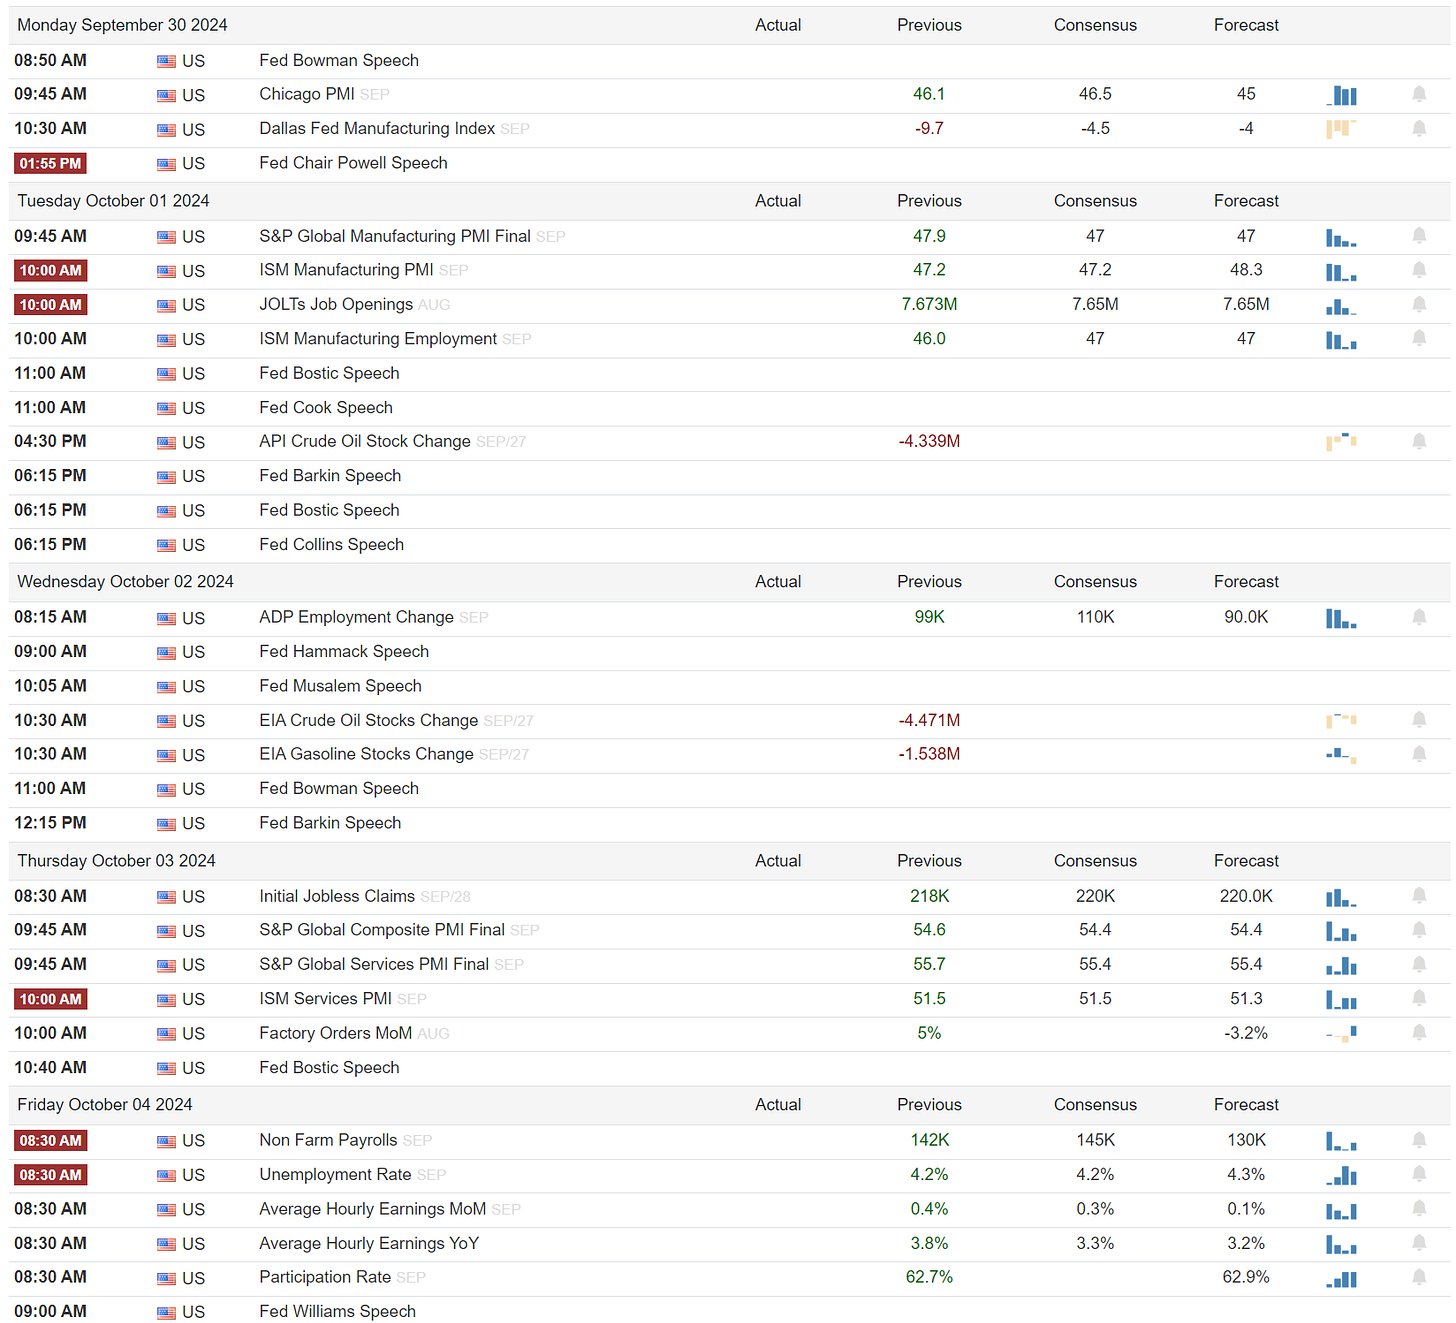
Events On Deck This Week
Here are key events happening this week that have the potential to cause outsized moves in the market or heightened short-term volatility.
Econ
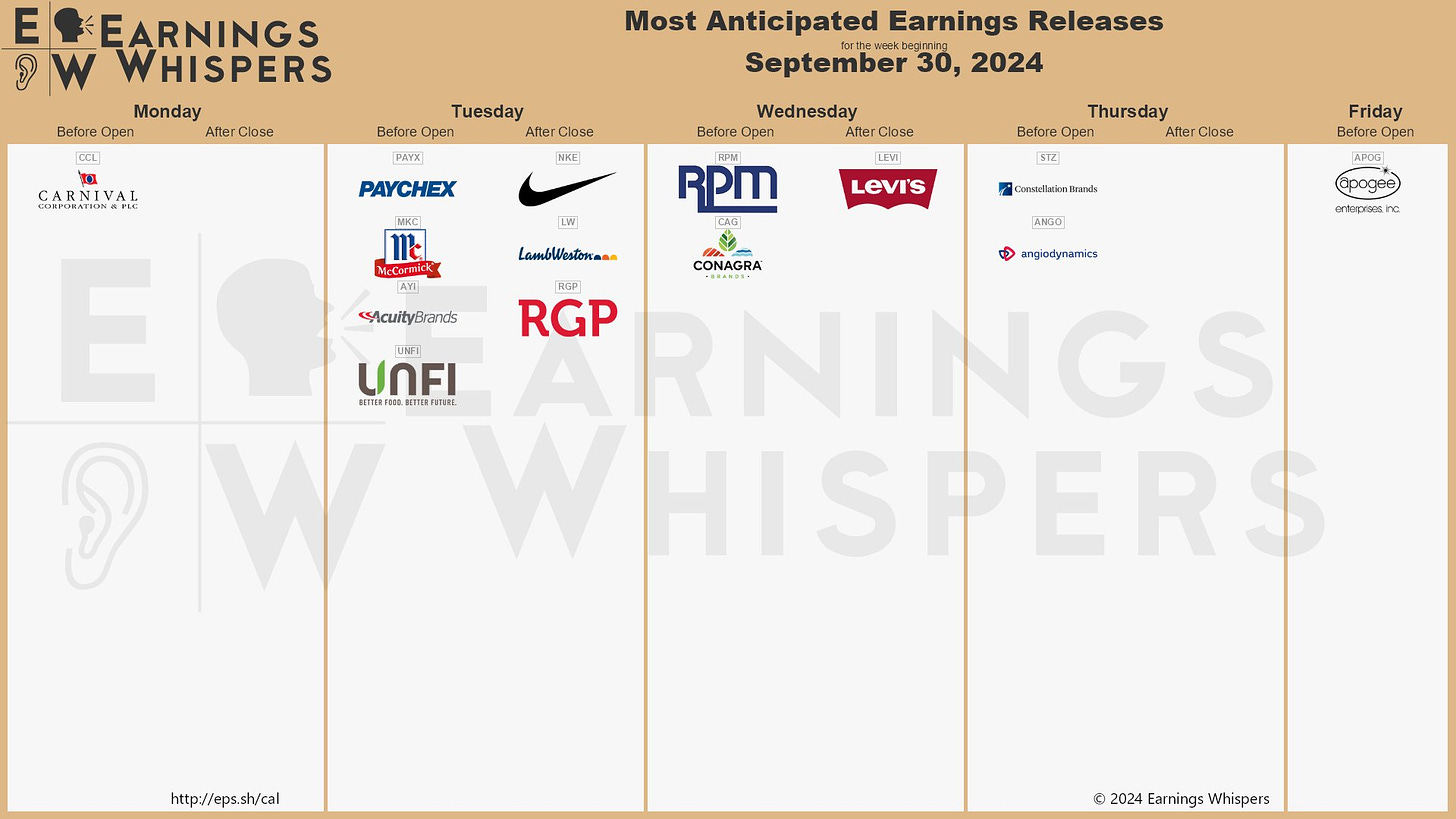
Earnings
A Final Word
Thank you for reading this week's edition of Market Momentum. If you found value in this content, please consider sharing it with a friend or colleague, in a Discord or a Tweet. This small favor helps keep this stack free for you! Please check out VolumeLeaders.com for your own free trial of the platform that brings you the data powering this stack. Wishing you all a green week ahead filled with many bags ❤️💰.


