Market Momentum: Your Weekly Financial Forecast & Market Prep
Issue 25 / What to expect Dec 16, 2024 thru Dec 20, 2024
In This Issue
Market-On-Close: All of last week’s market-moving news and macro context in under 5 minutes + futures-snapshots
Special Coverage: The Santa Claus Rally: Unpacking the Market Mechanics Behind the Year-End Surge
The Latest Investor Sentiment Readings
Institutional Support & Resistance Levels For Major Indices: Exactly where to look for a turn in markets this week in SPY, QQQ, IWM & DIA
Institutional Activity By Sector: Institutional flow by sector including the top names institutionally-backed names in those sectors
Top Institutional Orderflow In Individual Names: All of the largest sweeps and trade blocks on lit exchanges and dark pools
Investments In Focus: Bull vs Bear arguments for FTNT, VSCO, BAM, RL, MOMO, MRVL, FTXL
Top Institutionally-Backed Gainers & Losers: An explosive watchlist for day traders seeking high-volatility
Normalized Performance By Thematics YTD (Sector, Industry, Factor, Energy, Metals, Currencies, and more): which corners of the markets are beating benchmarks, which ones are overlooked and which ones are over-crowded
Key Econ Events and Earnings On-Deck For This Week
Market-On-Close
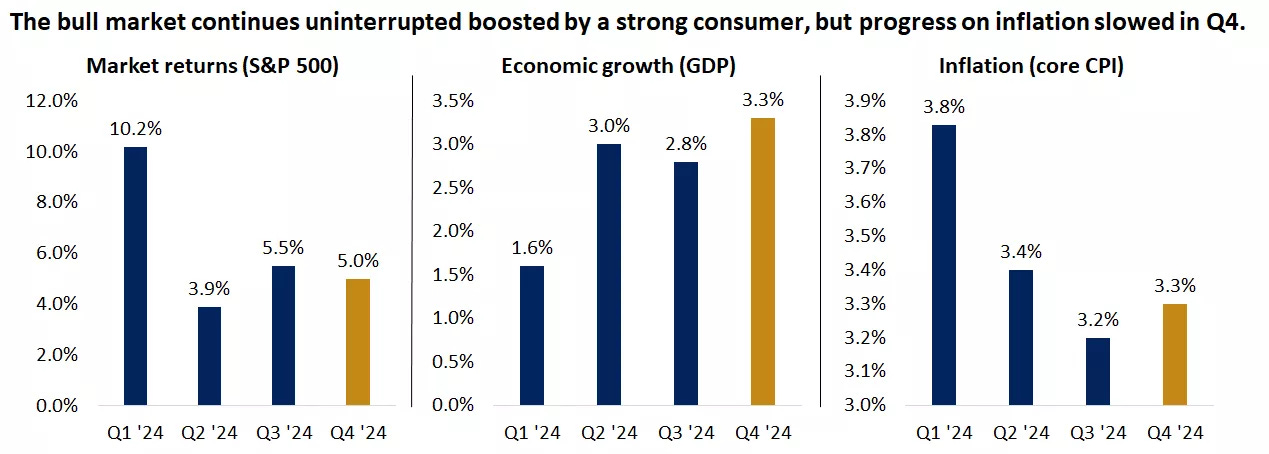
The U.S. financial markets have exhibited remarkable resilience and complexity over the past year, driven by a confluence of economic factors, corporate performance, and monetary policy shifts. Last week, this resilience was on full display as the Nasdaq Composite briefly surpassed the milestone 20,000 mark, capping off another chapter in a year characterized by strong market performance. The narrative underpinning these gains includes solid economic growth, robust corporate earnings, moderating inflation, and the initiation of monetary easing by central banks. However, as we approach 2025, signs of stalling progress in inflation improvement have introduced uncertainty into the outlook, particularly regarding the future actions of the Federal Reserve and other global central banks.
The November CPI Report: A Mixed Bag
The release of the November Consumer Price Index (CPI) offered a nuanced view of inflation's trajectory. On the one hand, the data provided some reassurance, as the results aligned with expectations, quelling fears of an inflationary resurgence. Core inflation, which excludes volatile food and energy prices, rose by 0.3%, keeping the annual rate steady at 3.3% for the third consecutive month. While this figure marks a significant decline from the 6.6% peak in 2022, it remains above the Federal Reserve's 2% target.
Notably, prices for discretionary goods and services, including cars, furniture, hotels, and airfare, accelerated during the month. This uptick likely reflects the strength of consumer spending, which has proven resilient despite economic headwinds. The impact of recent hurricanes also played a role in boosting demand and prices for certain goods, such as automobiles.
Encouragingly, shelter inflation—a key driver of price pressures in recent years—showed signs of easing. Housing costs increased by just 0.2%, the smallest monthly gain since early 2021, and the annual rate fell below 5% for the first time in over two and a half years. Market-based measures of rents and home prices suggest that this disinflationary trend may have further to go, offering hope that housing inflation will become less of a burden on the overall CPI.
Central Bank Actions: The Federal Reserve and Beyond
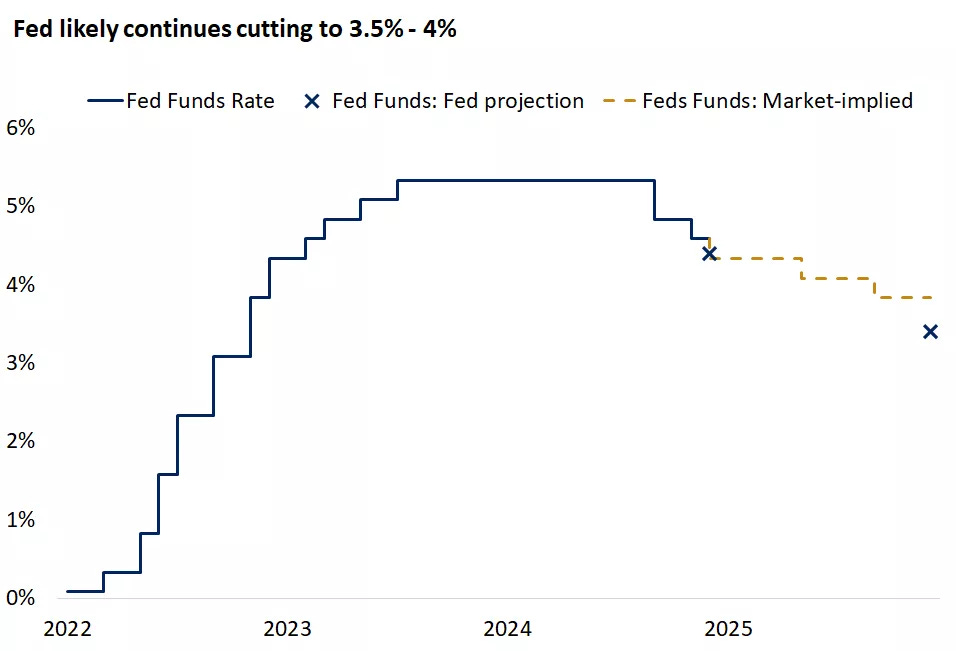
The Federal Reserve is widely expected to announce another rate cut following its December meeting. The November CPI data, coupled with a modest uptick in unemployment and subdued producer price inflation, have reinforced market expectations for a quarter-point reduction. Futures markets now assign a 97% probability to this outcome, reflecting heightened confidence among investors.
However, as we look ahead to 2025, the Fed faces a delicate balancing act. While the direction of monetary policy is clear—rates are expected to move lower—the pace and depth of easing remain uncertain. The Fed must navigate competing pressures, including persistent inflation, a robust labor market, and potential changes in fiscal and trade policies. Policymakers may adopt a more cautious approach in 2025, with projections suggesting a shallower rate-cutting cycle. Current forecasts point to two or three rate cuts next year, leaving the federal funds rate in the range of 3.5% to 4% by year-end.
The U.S. is not alone in grappling with these challenges. The Bank of Canada recently lowered its policy rate by half a percentage point, marking the fastest and deepest rate-cutting cycle among advanced economies. Meanwhile, the European Central Bank (ECB) and the Swiss National Bank also trimmed rates last week, citing downside risks to growth and inflation. These moves highlight the global nature of the current economic environment, where central banks are striving to strike a balance between supporting growth and containing inflation.
Market Performance: The Nasdaq Shines Amid Mixed Results
Amid these developments, the Nasdaq Composite achieved a historic milestone, briefly surpassing the 20,000 mark. This achievement underscores the strength of the technology sector, which has been a driving force behind the market's gains. Notable performers last week included semiconductor companies such as Broadcom, Nvidia, and Advanced Micro Devices, which benefited from robust demand and positive earnings results.
In contrast, the S&P 500 and Dow Jones Industrial Average faced headwinds, with the S&P posting a fractional decline and the Dow dropping nearly 2%. Large-cap growth stocks outperformed their value counterparts, continuing a year-long trend that has seen growth equities dominate. This dynamic was evident in the performance of key growth names like Tesla and Alphabet, which delivered double-digit gains last week.
Despite these gains, market breadth remains a concern. The Russell 2000 Index of smaller-cap stocks underperformed the S&P 500 for a second consecutive week, reflecting uneven participation in the rally. Sector performance was similarly mixed, with communication services and consumer discretionary leading the way, while other sectors lagged.
Inflation and Labor Market Dynamics
The interplay between inflation and labor market trends remains a focal point for policymakers and investors alike. While headline CPI ticked higher to 2.7% in November, the underlying trend suggests a deceleration in price pressures. Producer price inflation, which often serves as a leading indicator, rose by just 0.4%, and leading indicators point to a moderation in future inflation.
On the labor front, the past week's data painted a mixed picture. Initial jobless claims surged to a two-month high, raising concerns about potential softening in the labor market. Continuing claims also climbed, suggesting that unemployed individuals are taking longer to find jobs. These developments, combined with a slight uptick in the unemployment rate in November, indicate a cooling labor market that may provide the Fed with additional justification for easing monetary policy.
The Strength of the U.S. Dollar and Its Implications
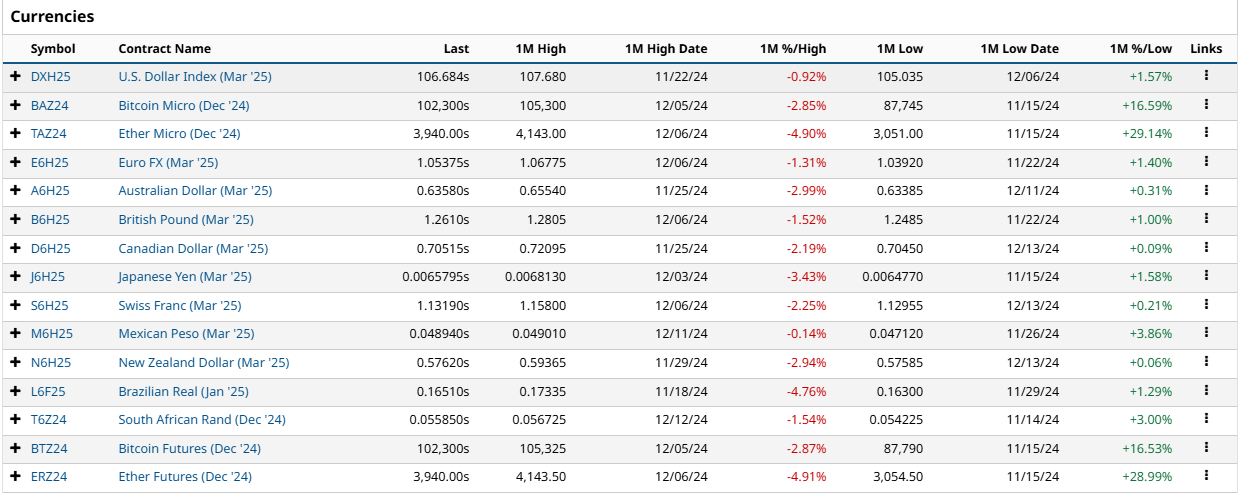
The strength of the U.S. dollar has emerged as a defining feature of the current economic environment. Divergent monetary policy paths between the U.S. and other major economies have bolstered the dollar against a basket of currencies, providing both opportunities and challenges. On the one hand, a strong dollar makes imported goods cheaper, helping to moderate inflation. On the other hand, it poses headwinds for U.S. exporters and multinational companies, which must contend with reduced competitiveness abroad.
From an investment perspective, the dollar's strength has supported U.S. equities, which tend to outperform during periods of currency appreciation. However, it has weighed on international and emerging market stocks, contributing to their relative underperformance.
Investor Sentiment and Market Outlook
Investor sentiment has remained buoyant, supported by strong economic data and the prospect of pro-growth policies following the U.S. presidential election. The NFIB Small Business Optimism Index recorded its largest monthly jump in three decades, reflecting renewed confidence among business owners. Capital spending, which had been delayed due to election uncertainty, is expected to rebound, potentially sustaining economic momentum into 2025.
However, elevated sentiment comes with risks. As expectations rise, the market becomes more vulnerable to periodic disappointments. The third year of a bull market is historically choppier, and with borrowing costs expected to remain relatively high, valuations may face limitations.
Conclusion: A Winning Formula Amid Uncertainty
As we close the year, the U.S. financial markets continue to demonstrate resilience in the face of uncertainty. The winning formula—comprising strong economic growth, rising corporate profits, moderating inflation, and monetary easing—remains largely intact. While challenges lie ahead, including the potential for slower disinflation and a more cautious Fed, the backdrop remains broadly supportive of balanced and diversified portfolios.
Looking ahead, the direction of monetary policy, the trajectory of inflation, and the health of the labor market will be key determinants of market performance. For investors, the focus should remain on long-term fundamentals, with an eye toward managing risks and capitalizing on opportunities in a dynamic and evolving landscape.
Futures Markets Snapshots
S&P 500: Sector Insights
Technology Sector:
Broadcom (AVGO): Shares surged 24.4% to a record high, elevating its market capitalization above $1 trillion. This leap was driven by robust earnings and a significant increase in AI-related sales.
Nvidia (NVDA): Despite the sector's overall strength, Nvidia's stock declined by 2.2%, potentially due to rising competition in the AI chip market.
Consumer Discretionary Sector:
Tesla (TSLA): The stock jumped 5.9% to a record high, bolstered by plans to develop a more affordable vehicle and favorable analyst ratings.
Lamb Weston (LW): Shares rose 6.8% amid buyout discussions with Post Holdings.
Healthcare Sector:
Walgreens Boots Alliance (WBA): The stock gained 6.8% following reports of potential acquisition talks with Sycamore Partners.
Industrials Sector:
Nucor (NUE): Shares fell nearly 4.7% after a downgrade from UBS, reflecting concerns over the steelmaker's valuation.
Communication Services Sector:
Alphabet (GOOG): The stock declined by 1.1%, contributing to the sector's underperformance.
Overall, the S&P 500 remained relatively flat for the week, with gains in technology and consumer discretionary sectors offset by declines in others.
ETF Insights
US Large Cap ETFs:
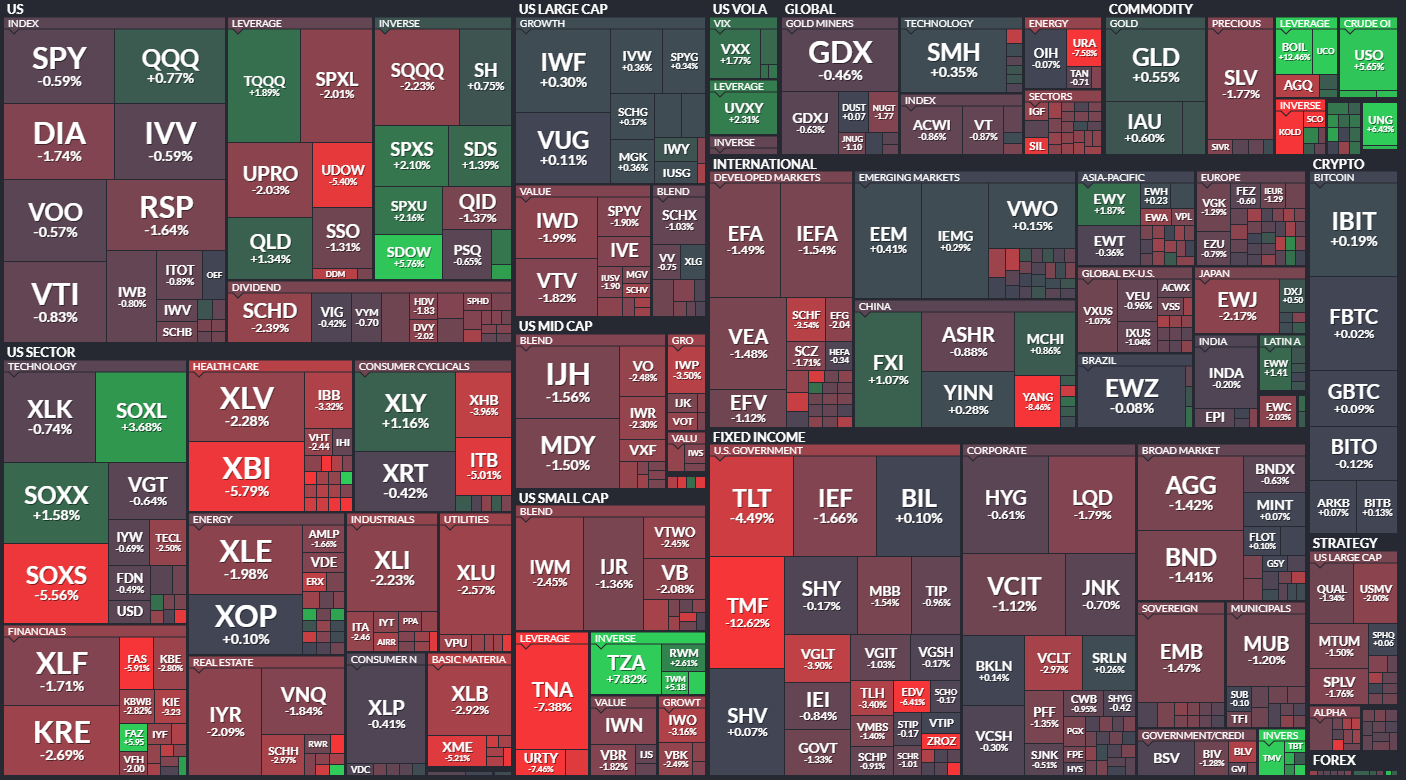
QQQ (+0.77%): The Nasdaq-focused ETF showed resilience, driven by strong performances in the technology sector, particularly in AI-related stocks. Microsoft (MSFT) and Nvidia (NVDA), key components of QQQ, remained influential despite mixed individual performances.
SPY (-0.59%) and VOO (-0.57%): The broader S&P 500 ETFs dipped slightly, reflecting overall market caution amid mixed sector performance. The weakness in financials and healthcare weighed heavily.
Leveraged ETFs:
SOXL (+3.68%): This triple-leveraged semiconductor ETF outperformed, boosted by a rebound in chip stocks like Broadcom (AVGO) and improved sentiment in AI-related industries.
SOXS (-5.56%): The inverse semiconductor ETF tumbled as bullish momentum in semiconductors took hold this week.
TNA (-7.38%): The small-cap leveraged ETF faced significant losses, as small-cap stocks continued to underperform in a challenging market environment, reflecting broader economic concerns.
US Sector ETFs:
XLY (+1.16%): Consumer discretionary ETFs gained modestly, led by strong performances from Tesla (TSLA) and other cyclical names. However, homebuilders like ITB (-5.01%) faced headwinds due to concerns over higher interest rates impacting housing demand.
XLV (-2.28%): The healthcare ETF saw significant declines, dragged down by underperformance in major pharmaceutical stocks like Eli Lilly (LLY) and UnitedHealth (UNH).
XLE (-1.98%): Energy ETFs declined as oil prices softened slightly despite volatility earlier in the week. Major names like ExxonMobil (XOM) and Chevron (CVX) faced selling pressure.
Global Markets:
EFA (-1.24%) and IEFA (-1.12%): Developed market ETFs posted losses amid ongoing concerns about slower growth in Europe and weaker-than-expected data from Japan.
MCHI (+0.86%): China-focused ETFs saw modest gains as Beijing announced additional stimulus measures to boost economic activity, aiding sentiment around Chinese equities.
Fixed Income:
TLT (-4.49%) and TMF (-12.62%): Long-duration Treasury ETFs fell sharply as bond yields surged, reflecting the market's ongoing adjustment to a higher-for-longer rate environment.
IEF (-1.66%): Intermediate-term Treasury ETFs were also under pressure, albeit to a lesser extent, as investors reassessed fixed-income positions.
BND (-1.41%): Broad bond ETFs declined across the board, weighed by rising yields and concerns about future rate hikes.
Commodity and Energy ETFs:
USO (+5.65%): Crude oil ETFs gained strongly, supported by geopolitical tensions in the Middle East and OPEC+ production cut talks, although broader energy stocks failed to capitalize.
GLD (+0.55%) and SLV (-1.77%): Gold held steady, reflecting a modest safe-haven bid, while silver struggled, pressured by industrial demand concerns.
Cryptocurrency ETFs:
BITO (+0.19%) and GBTC (+0.02%): Crypto-linked ETFs were flat to slightly positive as Bitcoin stabilized after recent gains, reflecting investor caution amid regulatory uncertainty.
The ETF landscape this week showcased divergent performances, with technology and consumer discretionary sectors leading gains while small caps, healthcare, and fixed-income ETFs underperformed. Rising bond yields and mixed global economic signals weighed on broader markets, creating a challenging environment for most equity and bond ETFs. Semiconductors and energy commodities were bright spots, highlighting selective areas of strength.
[Special Coverage] The Santa Claus Rally: Unpacking the Market Mechanics Behind the Year-End Surge
The "Santa Claus Rally" is a well-documented phenomenon in financial markets, describing the tendency for stock markets to rise during the last week of December and the first two trading days of January. This seemingly magical year-end surge has fascinated traders and investors for decades, prompting many to seek out the underlying mechanics driving this seasonal trend. While the rally might appear to be a quirk of holiday cheer, it is rooted in a mix of behavioral, seasonal, and structural market factors—including institutional options positioning, tax considerations, and investor sentiment. We cover some of these dynamics and shed light on why the Santa Claus Rally occurs and how it continues to influence market behavior.
Behavioral and Seasonal Factors
1. Tax-Loss Harvesting and Portfolio Rebalancing
One of the most prominent drivers of the Santa Claus Rally is the phenomenon of tax-loss harvesting. Investors often sell underperforming stocks at year-end to offset capital gains and reduce their tax liabilities. This selling pressure, which peaks in early December, temporarily depresses prices. As the tax-loss harvesting season concludes, the absence of selling pressure allows markets to rebound.
Simultaneously, institutional investors engage in portfolio rebalancing, aligning their holdings with annual targets or client mandates. This activity often involves buying high-performing stocks to "window dress" portfolios, making them appear more attractive in year-end reports. Combined, these actions create a favorable environment for a year-end rally.
2. Positive Holiday Sentiment
The holiday season is a time of optimism and goodwill, which often extends to investor behavior. Positive sentiment—fueled by end-of-year festivities and anticipation for the new year—can drive buying activity. This sentiment-driven behavior reinforces upward market momentum.
3. Retail Investor Activity
The holiday season often brings year-end bonuses and tax refunds, some of which find their way into the stock market. Retail investors, encouraged by holiday optimism and spare cash, contribute to increased buying pressure during this period.
Market Structure and Options Dynamics
1. Gamma Squeezes: Dealers and Hedging Dynamics
A significant yet often overlooked contributor to the Santa Claus Rally is the impact of institutional options positioning. Dealers, who sell options contracts to traders, manage their risk through hedging.
Gamma Exposure: When dealers are short gamma (as they often are when selling options), they must buy the underlying asset as prices rise to maintain a delta-neutral position. During the holiday season, as positive sentiment and low liquidity push stock prices upward, dealer hedging amplifies the rally through continuous buying.
2. Low Volatility and Charm Effects
The holiday season typically features reduced trading volumes as institutional desks slow down for the year-end break. Lower liquidity often coincides with lower implied volatility (IV) in the options market. This dynamic creates two key effects:
Charm: As options near expiration, their delta (sensitivity to price changes) decreases due to time decay. Dealers must adjust their hedges by buying the underlying stock, reinforcing upward pressure.
Vanna: Declining implied volatility reduces the need for dealers to hedge their positions, which often involves buying back underlying assets, further boosting prices.
3. Options Expiration and Roll Effects
The month of December is crucial for the options market, as it marks the expiration of quarterly and annual options contracts. These expirations often necessitate significant adjustments:
Hedging for Expiration: As options near expiration, institutions and dealers unwind positions, leading to increased trading in the underlying assets. In bullish environments, this can amplify upward price movements.
Rolling Positions: Investors and institutions roll their expiring options into future months, creating demand for both options and the underlying stocks.
The cumulative effect of these adjustments can provide an additional tailwind for stocks heading into the new year.
4. Window Dressing by Institutions
Window dressing—the practice of adding well-performing stocks to portfolios for year-end reporting—is another structural factor. This institutional buying creates additional demand for already strong stocks, driving their prices higher and contributing to the broader rally.
These flows are particularly pronounced in December due to the confluence of options expirations and reduced liquidity.
Sentiment and Anticipation for the January Effect
The "January Effect," a related seasonal phenomenon, describes the tendency for stocks—particularly small-cap stocks—to outperform in the first month of the year. Investors anticipating this trend often position themselves in late December, contributing to the Santa Claus Rally.
Additionally, market participants may front-run expected inflows from pension funds and other institutional investors, creating a virtuous cycle of buying that feeds the rally.
Conclusion
The Santa Claus Rally is more than just a seasonal curiosity—it is a reflection of deep-seated market mechanics, behavioral tendencies, and structural dynamics. From tax-loss harvesting and retail buying to the complex interplay of options hedging and institutional rebalancing, a myriad of factors converge to create the year-end surge. Understanding these forces provides traders and investors with a roadmap to navigate and capitalize on this seasonal phenomenon.
By appreciating the underlying mechanics—especially the role of institutional options positioning—market participants can better prepare for the opportunities and risks that accompany the rally. While the Santa Claus Rally may be steeped in tradition, its drivers are anything but magical; they are rooted in the very structure of financial markets, making it a predictable and exploitable pattern for those who understand its nuances.


