Market Momentum: Your Weekly Financial Forecast & Market Prep
Issue 37 / What to expect March 17, 2025 thru March 21, 2025
In This Issue
Market-On-Close: All of last week’s market-moving news and macro context in under 5 minutes + futures-at-a-glance
The Latest Investor Sentiment Readings
Institutional Support & Resistance Levels For Major Indices: Exactly where to look for support and resistance this week in SPY, QQQ, IWM & DIA
Institutional Activity By Sector: Institutional order flow by sector including the top institutionally-backed names in those sectors. We break it all down and provide the key insights and take-aways you need to navigate institutional positioning this week.
Top Institutional Order Flow In Individual Names: All of the largest sweeps and blocks on lit exchanges and hidden dark pools
Moneyflow Charts for: SPY, QQQ, NVDA, IVV
Investments In Focus: Bull vs Bear arguments for K, LRCX, TD
Top Institutionally-Backed Gainers & Losers: An explosive watchlist for day traders seeking high-volatility
Normalized Performance By Thematics YTD (Sector, Industry, Factor, Energy, Metals, Currencies, and more): which corners of the markets are beating benchmarks, which ones are overlooked and which ones are over-crowded
Key Econ Events and Earnings On-Deck For This Week

Market-On-Close
US Market Weekly Analysis: Correction Territory Amid Trade Policy Uncertainty
Market Performance Assessment
The week concluded with U.S. equity markets experiencing their fourth consecutive negative weekly performance, with the S&P 500 briefly entering correction territory, defined as a 10.5% drawdown from recent peaks—the first such correction since October 2023. Despite Friday's relief rally, the index closed down 2.3% for the week. The Dow Jones Industrial Average underperformed with a 3.07% decline, while transportation stocks demonstrated particular weakness, declining more than 6% as airlines issued downward guidance revisions.

Monday's session initiated substantial downward pressure with the S&P 500 declining nearly 3%, effectively negating the previous Friday's late-session recovery and decisively breaching the 200-day moving average. Large-capitalization technology stocks, which have been primary market drivers since 2023, led the decline with the NYSE FANG+ index contracting approximately 5%.
Tuesday's market dynamics shifted toward sector rotation rather than broad-based selling, with select large-capitalization technology and artificial intelligence companies demonstrating relative strength following Oracle's positive demand commentary. However, weakness simultaneously emerged in consumer-oriented equities as multiple airlines reduced forward guidance ahead of scheduled investor conferences, and retailers expressed cautious outlooks.
Wednesday produced mixed trading patterns despite inflation metrics registering below consensus expectations. By Thursday, market conditions deteriorated significantly with broad-based declines across asset classes, pushing the S&P 500 fully into correction territory at 10.5% below recent highs.
Friday finally produced the technical rebound that various indicators had been suggesting was imminent. The Relative Strength Index had declined below 30 for the first time since October 2023, while the VIX futures curve had inverted into backwardation—both historically reliable signals of oversold conditions. The S&P 500 appreciated 2.13%, the Dow Jones Industrial Average gained 1.65%, and the Nasdaq Composite outperformed with a 2.49% advance.

Despite Friday's recovery, every major U.S. equity index has now entered negative territory for 2025, with the S&P 500 down 4.4% year-to-date, representing approximately $5 trillion in eroded market capitalization since February's peak. This correction represents a significant reversal after nearly two years of extraordinary market appreciation.
Trade Policy Implications and Tariff Dynamics
The predominant catalyst for market volatility remains the escalation of trade tensions and tariff implementation. Tuesday's announcement of 25% tariffs on Canadian and Mexican imports, combined with the doubling of Chinese tariffs from 10% to 20%, generated significant uncertainty regarding global supply chains and corporate profitability. The administration further reinforced its protectionist stance by reiterating the April 2 deadline for implementing reciprocal tariffs on additional foreign nations.
The mid-week period witnessed predictable retaliatory measures from trading partners. The European Union implemented tariffs on $28.3 billion of U.S. exports, including agricultural products such as soybeans, beef, and poultry. Canada responded with 25% counter-tariffs on approximately $20.8 billion of U.S. products spanning computers to sporting goods. China subsequently announced retaliatory tariffs on roughly $22 billion of U.S. goods, with particular focus on agricultural exports.
This escalating sequence of reciprocal trade barriers has generated substantial concern regarding potential disruption to global commerce and economic growth trajectories. Several corporate executives have begun citing "uncertainty" as justification for downward guidance revisions. This phenomenon warrants close monitoring for potential expansion into a broader pre-announcement trend as first-quarter earnings season approaches.
The administration appears committed to its trade agenda despite market volatility. References to a "period of transition" for the U.S. economy suggest an acknowledgment of near-term disruption in pursuit of longer-term policy objectives. The critical analytical questions center on the duration and magnitude of this transitional period.
Inflation Metrics and Monetary Policy Outlook
Wednesday's Consumer Price Index data, which would typically represent the focal point of market analysis, was largely overshadowed by trade policy developments. Nevertheless, the metrics demonstrated continued disinflationary progress. Headline CPI increased 0.2% month-over-month and 2.8% year-over-year, both marginally below consensus expectations and significantly reduced from January's readings of 0.5% and 3.0%, respectively.
Core CPI moderated to 0.3% month-over-month and 3.1% year-over-year, again below forecasts and January's elevated readings of 0.4% and 3.3%. Importantly, both goods and services components showed disinflationary momentum.
In the goods category, new vehicle prices unexpectedly declined 0.1% despite the potential for tariff-related price increases, while used vehicle prices moderated substantially. Services inflation demonstrated cooling shelter costs at 0.3% versus the previous 0.4%, while transportation services declined 0.8% as airline prices contracted 4%. Motor vehicle insurance, which has been a persistent inflationary component, moderated to a 0.3% increase from the previous month's 2% surge.
The Producer Price Index data released Thursday reinforced the disinflationary trend, with the headline figure flat month-over-month and the core component actually declining 0.1%. Notably, approximately two-thirds of the increase in the final demand index was attributable to egg prices, representing a highly concentrated rather than broad-based inflationary pressure.
Market participants largely discounted the improving inflation metrics for two primary reasons: expectations for Federal Reserve policy accommodation have shifted dramatically amid the evolving economic uncertainty, and certain Personal Consumption Expenditures components within these reports (notably medical insurance and portfolio management fees) did not demonstrate commensurate disinflationary progress.
The most problematic development for monetary policy appeared in Friday's University of Michigan consumer survey. Consumer sentiment declined for the third consecutive month, effectively reversing all improvements from the latter half of 2024. More concerning, inflation expectations increased substantially—one-year expectations advanced to 4.9% from 4.3%, while five-year expectations rose to 3.9% from 3.5%. This trend is particularly notable as it occurred despite declining oil prices, which typically correlate strongly with inflation expectations.
The Federal Open Market Committee convenes next week (March 18-19), though monetary policy has diminished in relative importance amid the current market focus on trade policy. Rate cut expectations have been dramatically recalibrated, with markets now pricing 1-2 reductions for 2025 compared to 6+ cuts anticipated in January. The committee is universally expected to maintain current policy rates, with Chair Powell likely to maintain consistent messaging regarding the solid economic foundation, acknowledgment of increased uncertainty, continued monitoring of inflation trends, and a deliberate approach to policy adjustments.

The forthcoming Summary of Economic Projections will provide updated forecasts, though substantial deviation from the previous dot plot indication of two rate cuts this year appears unlikely. Commentary regarding the timeline for reducing quantitative tightening, currently anticipated around mid-year, remains a potential variable of interest.
Fixed Income Market Dynamics
Treasury yields have stabilized following their recent decline, concluding essentially unchanged for the week. The 10-year yield settled at 4.314% after appreciating 4.6 basis points on Friday. The fixed income market's behavior has been notable for its divergence from typical correction patterns—despite substantial equity market volatility, Treasury securities have not experienced the conventional flight-to-safety appreciation that typically accompanies equity corrections.
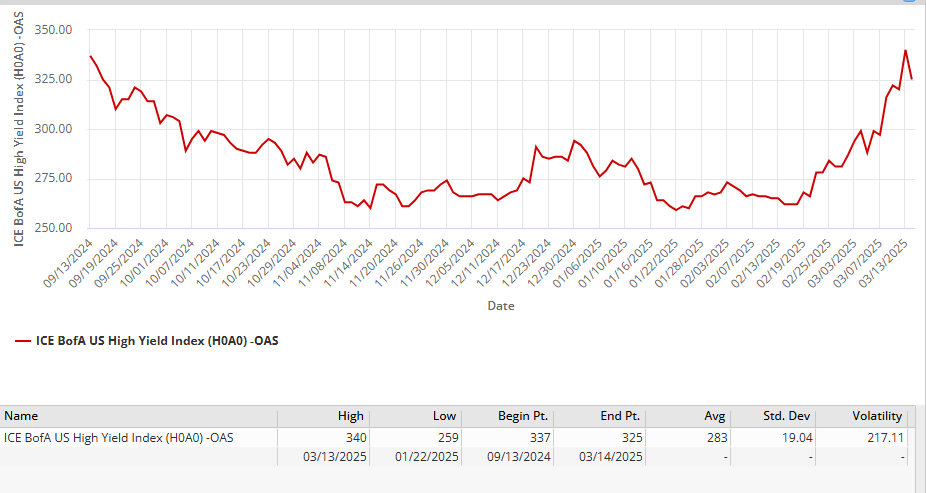
Credit spreads have begun widening, with high-yield option-adjusted spreads expanding toward 370 basis points. While this represents a meaningful adjustment, it remains substantially below distress levels observed during previous correction phases.


European sovereign debt markets presented mixed performance. German 10-year yields increased 2.1 basis points to 2.876% following reports that German chancellor-designate Merz had reached an agreement with the Green party regarding a substantial fiscal reform package targeting infrastructure and defense expenditures. This initiative could potentially inject approximately €500 billion into the German economy. The 10-year UK gilt yield declined 1.1 basis points to 4.666%.
Forward-looking market indicators suggest a 53% probability of a 25 basis point reduction from the European Central Bank at their April 17 policy meeting. ECB Governing Council member Holzmann has advocated for maintaining current rates, suggesting they have already reached neutral levels and that increased European fiscal expenditures could potentially necessitate rate increases if inflation resurges.
International Markets and Currency Dynamics
Non-U.S. equity markets have maintained their relative outperformance versus U.S. equities—a persistent trend throughout 2025. Most European indices concluded with modest weekly declines, though the German DAX appreciated nearly 2% on Friday to finish the week unchanged following reports of fiscal package developments.
Asian markets demonstrated relative stability. The most significant development emerged from China, where the CSI 300 index advanced 1.7% weekly, reaching its highest level of 2025. Market sentiment improved on expectations that the People's Bank of China will reduce its reserve requirement ratio in the near term. Chinese officials announced a Monday press conference where they are expected to introduce measures to stimulate domestic consumption—a critical initiative given China's continued deflationary environment, with CPI registering -0.7% year-over-year in February.
The euro maintained stability around 1.09, while gold continued its substantial appreciation, exceeding $3,000 for the first time as investors diversified away from U.S. assets. Bitcoin recovered significantly, concluding the week with a 6.74% gain at $84,654 following an 18-6 Senate banking committee vote to advance a stablecoin bill endorsed by the administration.
Sector Performance Analysis and Equity Highlights
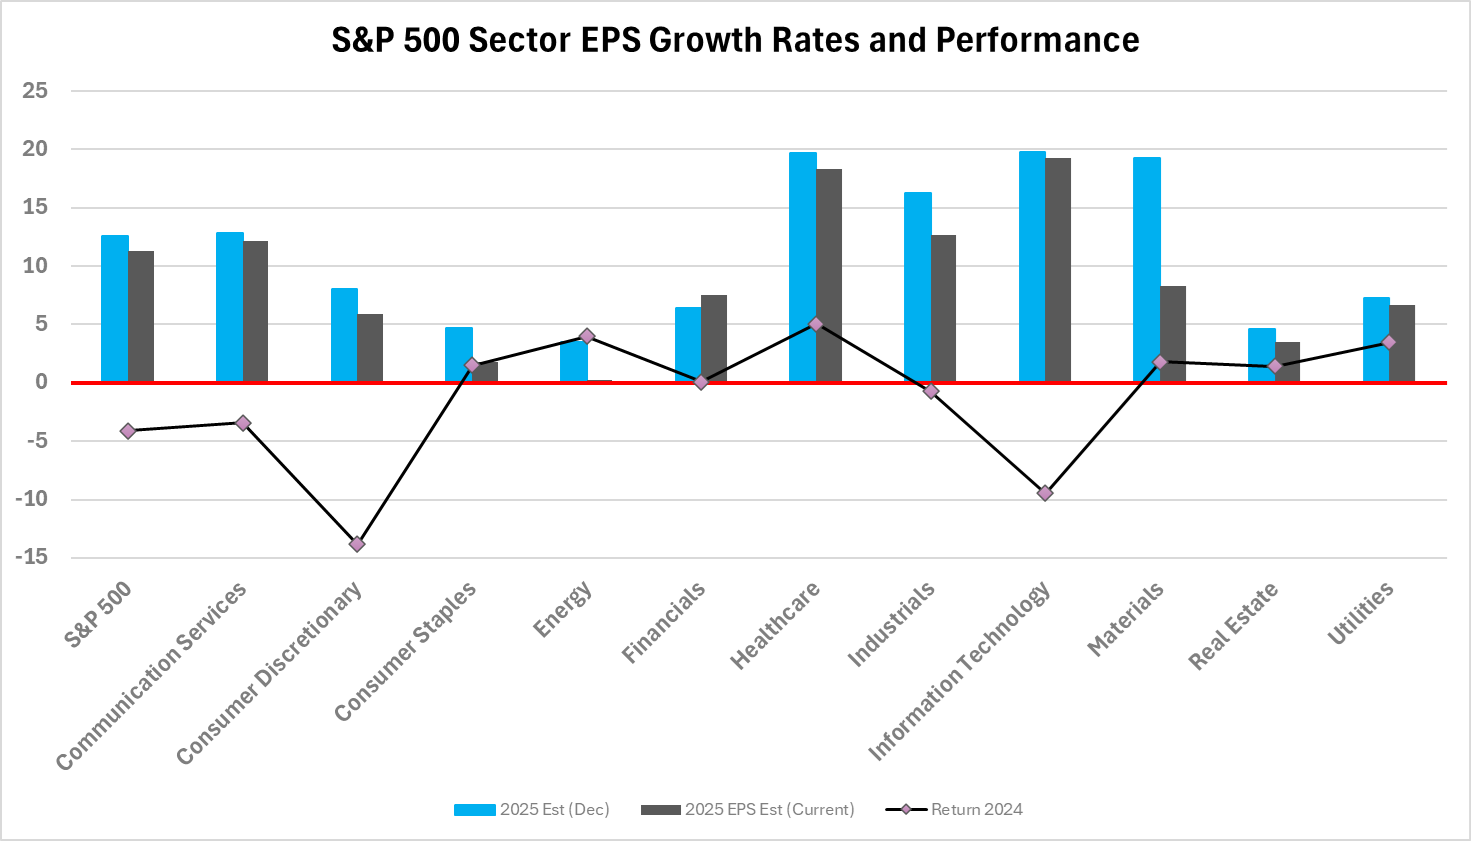
The current correction has fundamentally altered sector leadership patterns from those observed in 2023 and early 2024. Defensive and cyclical sectors now outperform technology and growth components—five of the eleven S&P sectors maintain positive year-to-date performance despite the broader market decline.

Friday's recovery saw the largest technology companies (frequently termed the "Magnificent Seven") advance uniformly, reasserting leadership after leading market declines earlier in the week. Nvidia appreciated more than 5% to lead Dow constituents, while Tesla gained over 3%. Meta Platforms, Microsoft, and Amazon all appreciated more than 2%, with Apple and Alphabet adding more than 1% each.
Semiconductor equities demonstrated significant strength on Friday, with Micron Technology appreciating over 6% following Aletheia Capital's upgrade to buy with a $145 price target. ARM Holdings, Lam Research, Applied Materials, GlobalFoundries, Microchip Technology, and Qualcomm all registered gains between 3% and 6%.
Cryptocurrency-related equities appreciated substantially alongside Bitcoin's recovery. MicroStrategy led Nasdaq 100 constituents with a 13% gain. MARA Holdings advanced more than 7%, while Riot Platforms and Bit Digital both gained over 6%. Coinbase appreciated more than 2%.
Notable earnings-driven performance included DocuSign, which gained over 14% after projecting stronger-than-anticipated 2026 billings. Semtech appreciated more than 20% after exceeding fourth-quarter earnings expectations. Ulta Beauty led S&P 500 constituents, gaining over 13% after substantially exceeding earnings forecasts. Rubrik advanced more than 27% following an optimistic revenue projection.
Among decliners, Abbott Laboratories fell nearly 3% to lead S&P 500 underperformers after a judicial reversal regarding a previous infant formula verdict. T-Mobile declined more than 1% following Citigroup's downgrade to neutral from buy on valuation considerations. The most significant underperformer was Xponential Fitness, which declined 39% after providing below-consensus full-year revenue guidance.
Economic Indicators Assessment
The macroeconomic landscape presents mixed signals. Job openings unexpectedly increased to 7.74 million from 7.51 million, maintaining the ratio of openings to unemployed workers near pre-pandemic levels. Separations declined modestly and remain substantially below twenty-year averages. Initial unemployment claims stabilized around 220,000 while continuing claims moderately decreased. These metrics collectively suggest no material deterioration in labor market conditions.


However, concerning indicators have emerged regarding economic growth. The United Kingdom economy unexpectedly contracted 0.1% in January, contradicting forecasts for 0.1% expansion. Key economic forecasters have revised U.S. growth projections downward from 2.4% to 1.7%, primarily attributable to deteriorating tariff-related assumptions.
The Bank of Canada reduced its policy rate by 25 basis points to 2.75%, with policymakers specifically identifying the U.S.-Canada trade dispute as a "new crisis" affecting consumer expenditures and business investment. Their assessment was unambiguous: "monetary policy cannot offset the impacts of a trade war."
Corporate Developments
Beyond quarterly results, several significant corporate developments emerged this week. Taiwan Semiconductor Manufacturing is reportedly negotiating with U.S. semiconductor designers, including Nvidia and Broadcom, regarding potential equity participation in a joint venture to operate Intel's fabrication facilities—a potentially transformative restructuring of the semiconductor industry landscape.
The Federal Trade Commission is advancing an antitrust investigation of Microsoft initiated during the final phase of the previous administration. Regulators have required disclosure of data regarding Microsoft's artificial intelligence operations, introducing additional regulatory uncertainty to an already volatile technology sector.
Crown Castle appreciated over 8% after announcing agreements to divest portions of its fiber business to an EQT AB fund and Zayo Group Holdings for a combined $8.5 billion.
American Express gained over 3% following Baird's upgrade to neutral from underperform.
Market Technical Analysis
Technical indicators reached extreme levels during the week. The 16-day sequence of 1%+ intraday ranges represents the longest such period in recent years, and the VIX briefly approached 30 before moderating to approximately 22 by week's end. The Relative Strength Index on the S&P 500 declined below 30 mid-week for the first time since October 2023, signaling an oversold condition that historically precedes at least short-term recovery.
The VIX futures curve inverted into backwardation—indicating traders were paying premium for near-term protection versus longer-dated instruments—another historical marker of extreme risk aversion that frequently signals potential capitulation.
If the market can sustain positive momentum into Monday's session, it would represent the first consecutive positive sessions since mid-February, illustrating the persistent selling pressure of recent weeks.
Forward Outlook: First-Quarter Earnings Season Implications
With approximately one month remaining before first-quarter earnings reporting begins, markets have entered the critical pre-announcement period. Several sell-side investor conferences are scheduled for next week, along with significant earnings reports from FedEx, Lennar, Micron Technology, and Nike that could establish directional sentiment.
Valuations were elevated entering 2025, but were accompanied by substantial earnings expectations. At the conclusion of the fourth quarter, consensus projections indicated approximately 15% year-over-year earnings growth for companies in both the S&P 400 and 500. Despite generally positive fourth-quarter results, companies issued conservative forward guidance given the uncertain environment. This caution precipitated negative estimate revisions, with growth projections now reduced to approximately 12% for the S&P 500 and 9% for mid-capitalization companies.
A potential wave of negative pre-announcements in coming weeks would necessitate further downward estimate revisions. This week may represent the initial phase of such a trend, with multiple companies explicitly citing deteriorating consumer and corporate confidence as justification for guidance reductions.
Portfolio Positioning Strategy
Following two years of robust performance driven predominantly by large-capitalization technology and artificial intelligence themes, 2025 has abruptly underscored the importance of diversification. While broader U.S. equities have turned negative, several market segments have demonstrated resilience:
Defensive and cyclical sectors within domestic markets
Fixed income securities, which have outperformed equities year-to-date
International equities, particularly European markets and Chinese technology companies

The EuroStoxx index maintains a year-to-date appreciation exceeding 10%, benefiting from relatively attractive valuations, central bank policy accommodation, and renewed fiscal stimulus initiatives. Even a conventional 60-40 portfolio allocation has substantially outperformed the S&P 500 this year, providing meaningful downside protection during the correction phase.

For investors with extended time horizons, these market dislocations—while challenging—create potential opportunities for strategic rebalancing or selective additions across diversified asset classes. Within U.S. sectors, healthcare and financials appear particularly well-positioned should the administration implement anticipated deregulation and tax policy initiatives in coming quarters.

In fixed income markets, extending duration remains strategically attractive, particularly if 10-year Treasury yields approach 4.5%. Bond allocations will likely maintain their dual function as income generators and portfolio diversifiers as the Federal Reserve potentially initiates rate reductions later this year.

Week Ahead: Key Variable Monitoring
The Federal Open Market Committee meeting will generate substantial commentary, though as previously discussed, is unlikely to produce significant policy surprises. Market participants will scrutinize guidance regarding quantitative tightening and analyze the updated economic projections and dot plot forecasts.
Key economic data releases include:
Initial Unemployment Claims
Mortgage Applications
Retail Sales Advance
Industrial Production
Housing Starts
Existing Home Sales
However, market direction will likely continue to be primarily determined by trade policy developments and potential corporate pre-announcements ahead of earnings season. After Friday's recovery, the critical question remains whether markets have experienced genuine capitulation or merely a technical rebound within an ongoing correction phase.
Without conciliatory trade policy communications from Washington, any relief rally could prove ephemeral. The most telling aspect of Friday's recovery was the absence of additional negative policy headlines that might have undermined market sentiment—a significant indicator of current market sensitivity to trade policy developments.
Continued volatility appears probable in the coming week as markets attempt to establish a sustainable equilibrium amid evolving policy and economic conditions.

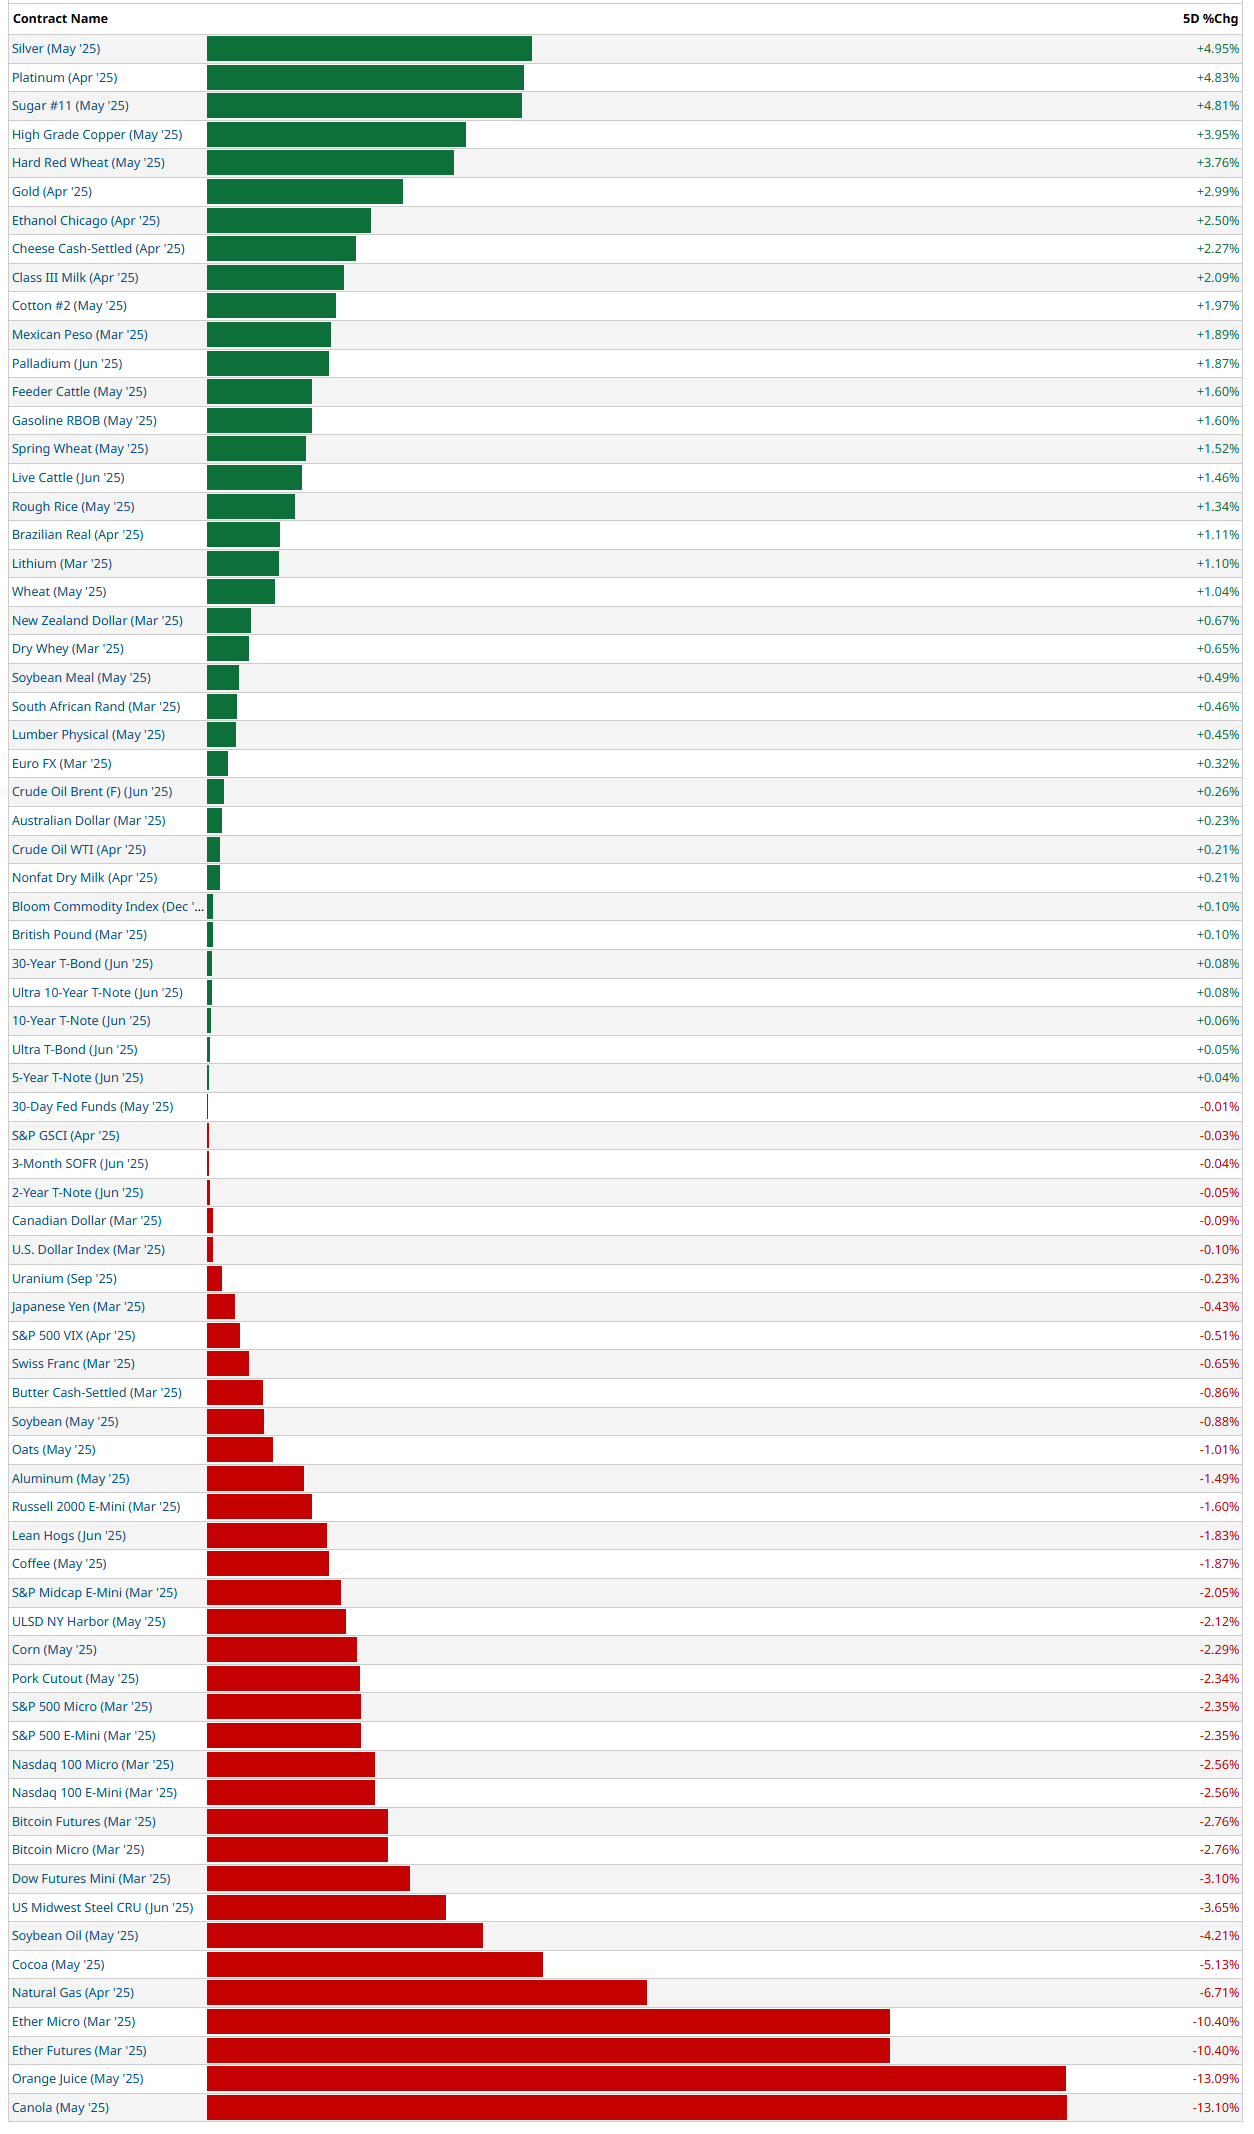
5-Day Futures Performance Leaders
S&P 500 Sector Insights

Tech Sector Divergence: There's a significant split in technology performance. NVIDIA ( NVDA 0.00%↑ ) is up strongly at +7.97%, while Apple ( AAPL 0.00%↑ ) is down considerably at -10.70%. This suggests a potential rotation within tech, with semiconductor stocks outperforming consumer tech.
Market Weakness Overall: A broadly negative week for the markets many stocks falling between -2% and -6%.
Consumer Sectors Under Pressure: Consumer-related stocks are showing particular weakness:
Home Depot ( HD 0.00%↑ ) down -6.76%
Walmart ( WMT 0.00%↑ ) down -6.95%
Costco ( COST 0.00%↑ ) down -6.20%
Consumer Electronics category also showing broad declines
Defensive Sector Resilience: Some traditionally defensive sectors like utilities are an island of green in a sea of red, suggesting investors may be rotating to safety.
Financial Weakness: Major financial institutions like JPMorgan ( JPM 0.00%↑ , -4.06%) and Visa ( V 0.00%↑ , -3.92%) are down significantly, indicating potential concerns about economic growth or interest rate impacts.
Berkshire Hathaway (BRK-B) stands out as one of the few large-cap companies in the green at +3.83%, showing investor flight to perceived quality and stability.
Big Tech Mixed: The "Magnificent Seven" tech stocks show mixed performance:
NVIDIA (+7.97%) is strongly positive
Amazon ( AMZN 0.00%↑ ) is relatively flat at +0.65%
Google/Alphabet ( GOOG 0.00%↑ ), Microsoft ( MSFT 0.00%↑ ), Meta ( META 0.00%↑ ) , and Apple all down
Healthcare Weakness: Healthcare stocks like Eli Lilly ( LLY 0.00%↑ , -6.45%) are showing significant declines.
In broad stroked, this appears to be a risk-off week with investors favoring select semiconductor stocks and defensive positions while selling consumer-focused companies, suggesting concerns about consumer spending and possibly the broader economic outlook.
5-Day Sector Leaderboard

5-Day Individual Performance Grouped By Sector (Size By Market Cap)

ETF Insights
Reviewing a heatmap like this weekly can be incredibly helpful for investors as it provides a quick and visual summary of market performance across various sectors, asset classes, and geographies.
1. Sector and Asset Class Trends
Identify Strong and Weak Sectors: Investors can quickly spot which sectors (e.g., technology, energy, healthcare) are performing well or underperforming.
Asset Class Diversification: Seeing how commodities, fixed income, equities, and cryptocurrencies performed helps assess diversification.
2. Market Sentiment
Risk-On or Risk-Off: A green-dominated map suggests bullish sentiment, while red indicates bearish sentiment. Investors can align their strategies accordingly.
Volatility Indicators: Observing movements in volatility indices (e.g., VIX) can highlight changing market dynamics.
3. Regional Analysis
Global Insights: Performance in developed and emerging markets (e.g., Europe, China, Asia-Pacific) helps in gauging international investment opportunities or risks.
Currency Impacts: Movements in forex or country-specific ETFs can indicate currency-driven market trends.
4. Thematic Trends
Growth vs. Value: Comparing the performance of growth ETFs (e.g., VUG) versus value ETFs (e.g., VTV) reveals the prevailing market preference.
Industry Leadership: Highlighting leadership within industries (e.g., gold miners, semiconductors) can inform thematic plays.
5. Monitoring Investments
Portfolio Alignment: Investors can track how their existing investments or watchlist align with broader market trends.
Rotation Signals: Seeing week-over-week changes in sector dominance may signal sector rotation opportunities.
6. Risk Management
Recognizing Overbought/Oversold Conditions: Consistent underperformance or overperformance in specific areas may indicate potential mean-reversion trades.
Correlation Awareness: By observing how different asset classes move, investors can manage portfolio correlation and risk.
7. Decision Support
Identify Outperformers/Underperformers: ETFs, sectors, or indices that repeatedly outperform or underperform can help refine trading or investment strategies.
Macro Perspective: Weekly trends highlight macroeconomic or geopolitical influences affecting markets.
Regularly reviewing a heatmap like this is a strategic practice that supports data-driven decision-making while fostering a holistic understanding of market dynamics.

Broad Market Weakness: Major index ETFs like SPY (-2.28%), QQQ (-2.47%), and DIA (-3.01%) are all showing significant declines, indicating a broadly negative week across US markets.
Inverse ETFs Still Performing Well: The green boxes in the "INVERSE" section (SQQQ +15.56%, SPXS +16.73%) show strong performance from bearish/short ETFs, confirming the downward market pressure.
Energy Sector Strength: Energy ETFs like XLE (+2.67%) and XOP (+3.14%) are among the few sectors showing positive performance, suggesting strength in energy stocks despite broader market weakness.
Precious Metals Rising: Gold and silver ETFs are continue performing well (GLD +2.55%, SLV +3.79%, IAU +2.51%), indicating a flight to traditional safe haven assets.
Oil Weakness: The crude oil section shows significant declines (USO -5.69%, BOIL -11.85%), showing a divergence between energy stocks and the underlying commodity.
Fixed Income Stability: Treasury and fixed income ETFs (TLT, SHV, IEF, BIL) are mostly flat to slightly positive, suggesting they're providing relative stability as equities decline.
Global Market Divergence: China exposure (YINN +6.65%, FXI +1.89%) and India (EWZ +4.11%) are showing strength while most developed international markets are down.
Sector Rotation: Consumer sectors (XLY, XRT, XLP) are showing significant weakness, while utilities (XLU) are declining less severely, indicating continued defensive positioning.
Volatility Up: The VXX ETF is up 0.39% on the week, showing persistent market fear/volatility.
Cryptocurrency Weakness: Crypto-related ETFs (IBIT -2.61%, GBTC -2.67%) are down, aligning with the broader risk-off sentiment.
Overall, we have a clear risk-off environment with investors moving away from equities (especially consumer and tech) toward traditional defensive assets like gold, silver, and selective energy positions, while also placing bets on emerging markets like China and India.
Global Overview
Foreign ADR stocks listed on NYSE, NASDAQ & AMEX categorized by geographic location. Reviewing a global heatmap like this weekly is valuable for investors because it offers insights into international markets, helping to:
Identify Global Trends: Spot which regions or countries are performing well or underperforming.
Assess Sector and Regional Performance: Understand how industries are faring across different regions.
Diversify Portfolios: Uncover opportunities in emerging or developed markets for greater diversification.
Gauge Global Sentiment: Recognize the impact of macroeconomic events on specific regions.
Align with Global Strategies: Refine investment strategies based on regional strengths or weaknesses.
This overview ensures investors stay informed about global opportunities and risks, complementing their domestic market analysis.

Regional Divergence: There's significant variation between different regions:
Latin American stocks (Brazil, Argentina) show considerable strength
European markets (particularly Germany, Netherlands, Ireland) show weakness
Asian markets are mixed with notable strength in select Chinese and Indian stocks
Standout Performers:
NU 0.00%↑ (Nubank from Cayman Islands) is up significantly at +8.51%
HDB 0.00%↑ (HDFC Bank from India) showing strong performance at +2.67%
PDD 0.00%↑ (PDD Holdings from China) up +2.19%
Several Brazilian stocks like ITUB 0.00%↑ (+5.16%), ABEV 0.00%↑ (+4.14%), and PBR 0.00%↑ (+3.95%) showing strength
Notable Decliners:
ACN 0.00%↑ (Accenture from Ireland) down -6.83%
NVS 0.00%↑ (Novartis from Switzerland) down -5.63%
INFY 0.00%↑ (Infosys from India) down -7.35%
SAP 0.00%↑ (SAP SE from Germany) down -4.67%
NXPI 0.00%↑ (NXP Semiconductors from Netherlands) down -7.39%
Sector Patterns:
Energy companies like BP 0.00%↑ (+4.12%), SHEL 0.00%↑ (+2.96%), and YPF 0.00%↑ (+4.90%) performing well
Financial services mixed with some strength in emerging markets (HDB, ITUB) but weakness in European banks
Technology showing weakness, particularly European tech (SAP, ASML, NVS)
Emerging Markets Outperforming: Generally stronger performance in emerging market stocks compared to developed markets, with Brazil, India, and select Chinese stocks showing particular strength
Canadian Weakness: Most major Canadian stocks (RY, BN, TD, ENB) are down, aligning with broader North American market weakness
Chinese Tech Mixed: Alibaba ( BABA 0.00%↑ ) slightly positive while JD.com is up more significantly, but other Chinese tech firms show varied performance
Luxury/Consumer Goods Pressure: European luxury brands and consumer companies showing weakness
This global ADR heatmap confirms a rotation toward emerging markets and energy stocks, while showing continued pressure on technology and financial stocks in developed markets. The pattern suggests investors are seeking value and growth opportunities in select emerging markets while reducing exposure to European stocks.
Want to keep reading? The full VL weekly report - loaded with names to watch and unique insights on institutional positioning you won’t find anywhere else - is only available to subscribers. You can follow me on Twitter/X for occasional free posts or you can sign-up today for real-time access to the only platform delivering critical context around institutional order flow for thousands of tickers without the wait 👇👇👇