Market Momentum: Your Weekly Financial Forecast & Market Prep
Issue 14 / What to expect Sept 23, 2024 thru Sept 27, 2024
Weekly Wrap-Up
Last week, the Federal Reserve took a bold step in its monetary policy approach, implementing its first interest rate cut in four years and marking a significant pivot in its strategy. This wasn't just any rate cut; it was a substantial half-percentage point reduction, bringing the policy rate down to a target range of 4.75%-5.0% from 5.25%-5.5%. This move reflects a decisive shift in focus from inflation control to broader economic stability and growth, indicating a nuanced approach to navigating current economic indicators.
Historical Context and Fed’s Strategy
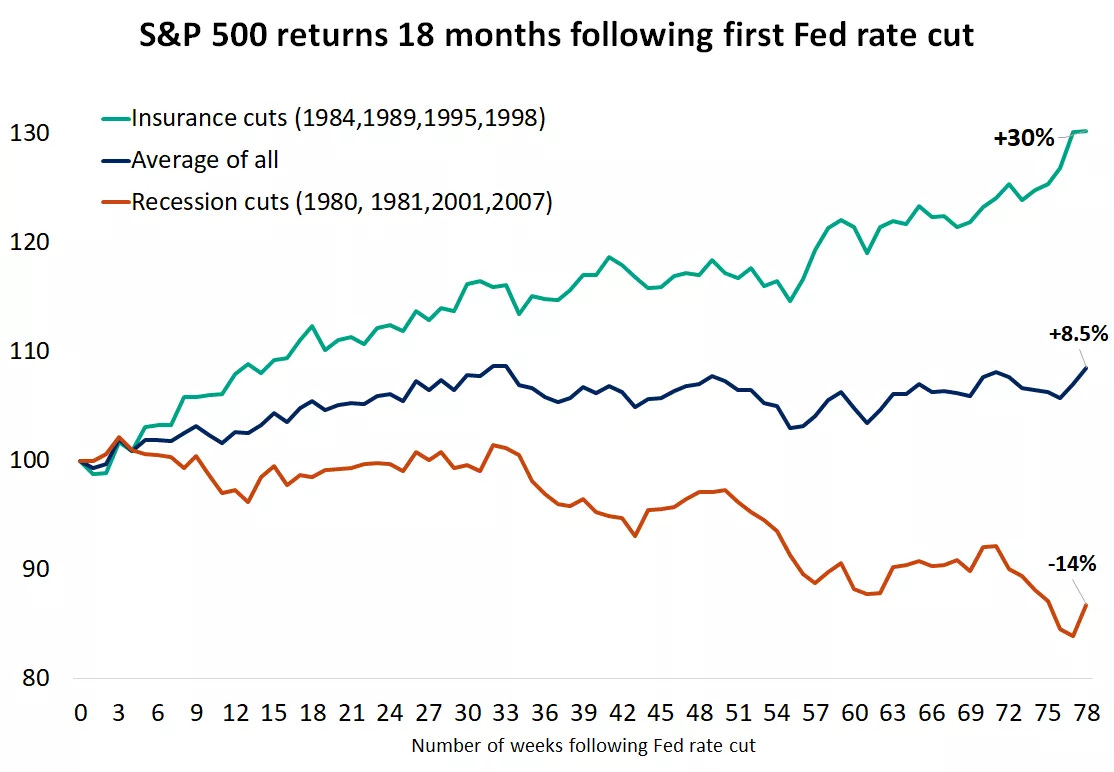
This rate cut is notable not only for its magnitude but also because it represents the beginning of what could be a prolonged easing cycle, the first in years that has commenced without the immediate threat of a recession. Historically, such preemptive rate cuts have been followed by robust equity market performance. Examples from the late 20th century and early 2000s show that when rate cuts occur in non-recessionary periods, they often set the stage for gains in equity markets over the following months.
However, current market conditions differ somewhat due to relatively high valuation levels. While past cycles of rate cuts in similar economic conditions have led to substantial market rallies, the elevated starting valuations in this cycle might temper the potential for significant upside in the stock markets. This introduces a cautious note for investors expecting historical patterns to repeat straightforwardly.
Economic Indicators and Fed’s Response
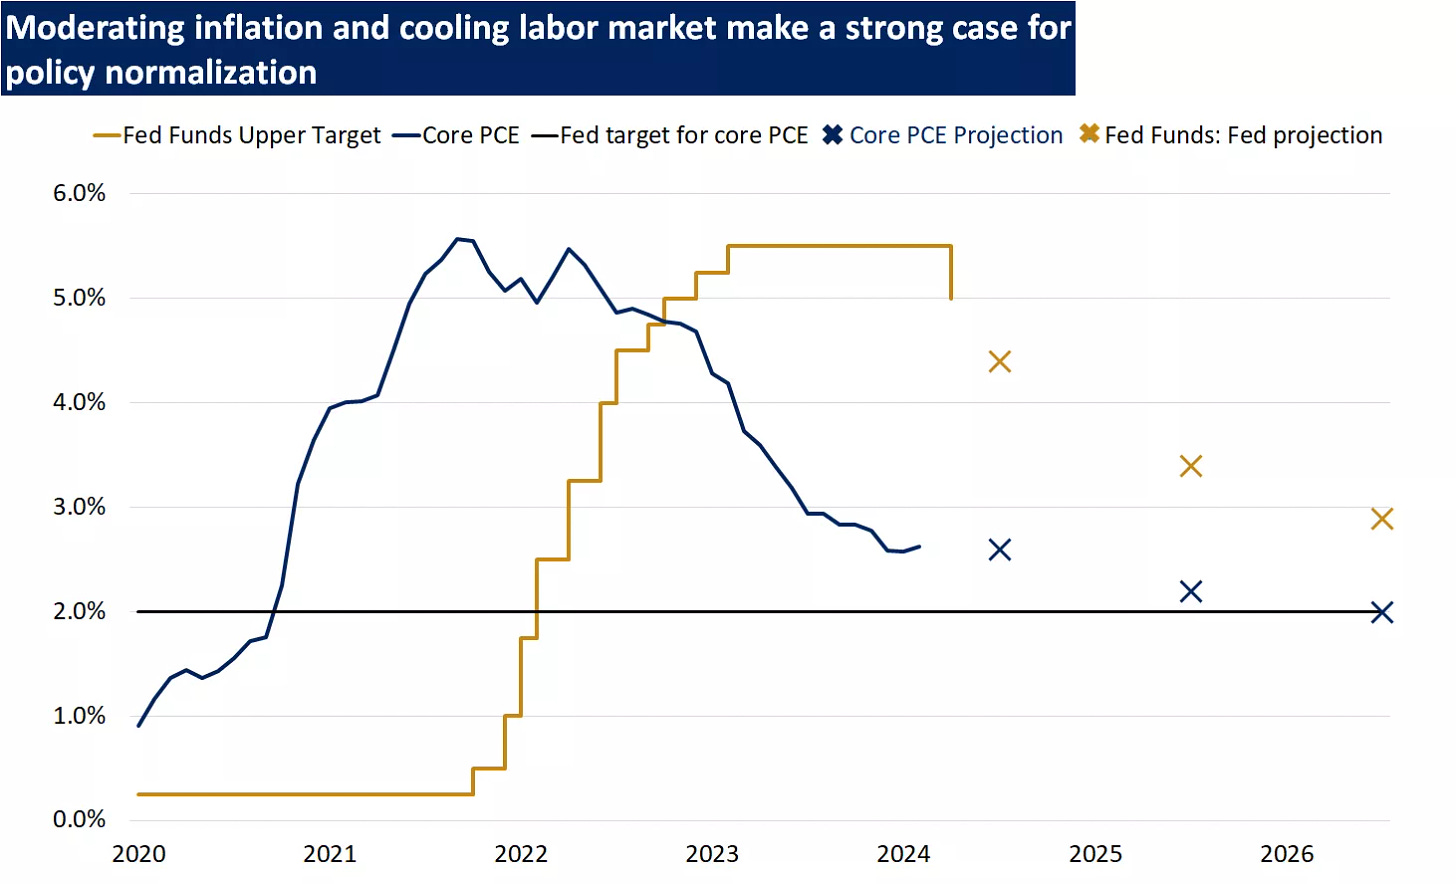
The decision to cut rates was supported by several factors: a substantial reduction in the consumer price index from a peak of 9.1% in June 2022 to 2.5% in August 2024, and a rise in the unemployment rate from 3.4% to 4.2%. These figures suggest that inflation is trending towards the Fed's target of 2%, allowing more room to maneuver on monetary policy without the immediate pressure of accelerating prices.
Moreover, the labor market shows signs of cooling without veering into distress, a delicate balance that the Fed aims to maintain. The increase in unemployment is seen more as a result of an expanding labor force rather than rising layoffs, which suggests a healthy adjustment rather than a downturn.
Implications for the Financial Markets and Economy
The rate cut is expected to lower borrowing costs over time, which should encourage consumer spending and business investment—critical components of economic growth. This financial stimulus is timely, given the mixed economic signals currently emanating from various sectors of the economy.
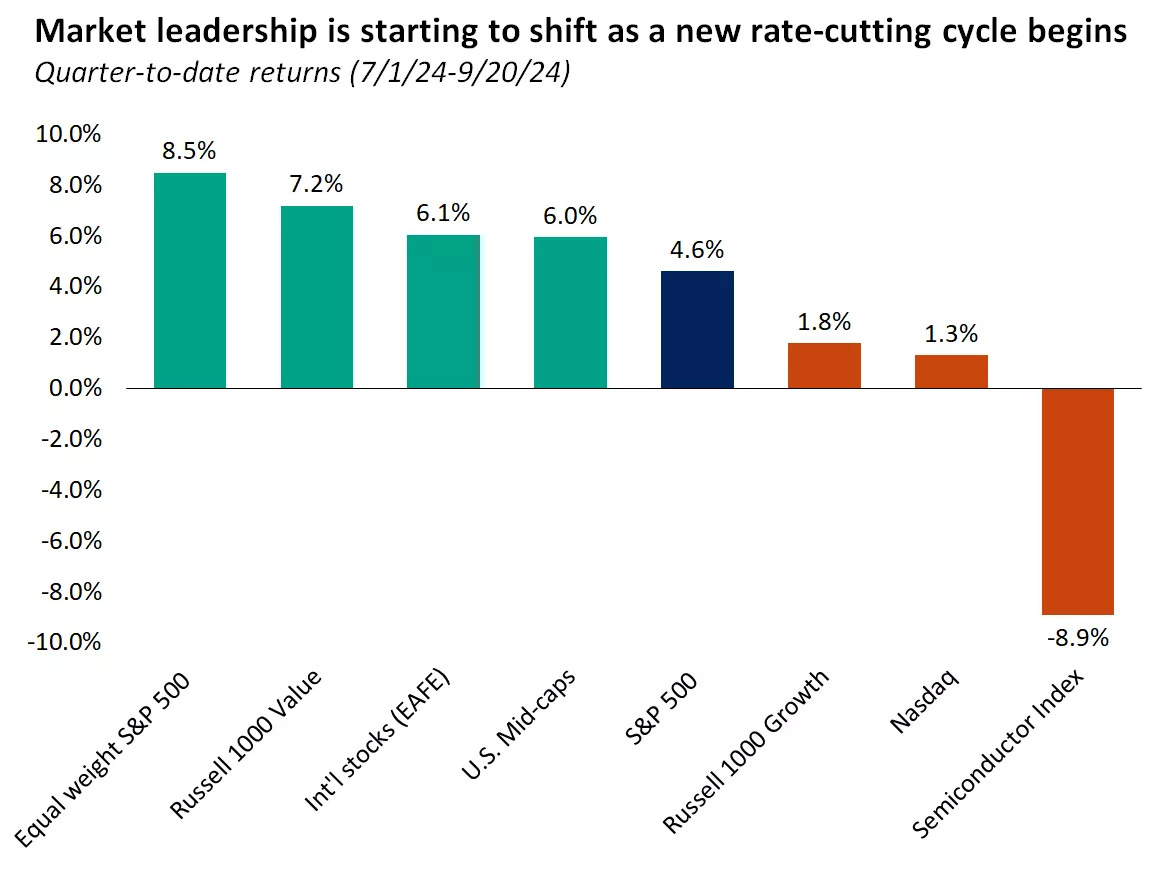
From a market perspective, sectors that are sensitive to interest rates, such as real estate and utilities, may benefit particularly in the near term. Additionally, mid-cap stocks and high-quality dividend-paying stocks might see increased attractiveness as investors search for yields in a lower rate environment.
Long-term Outlook
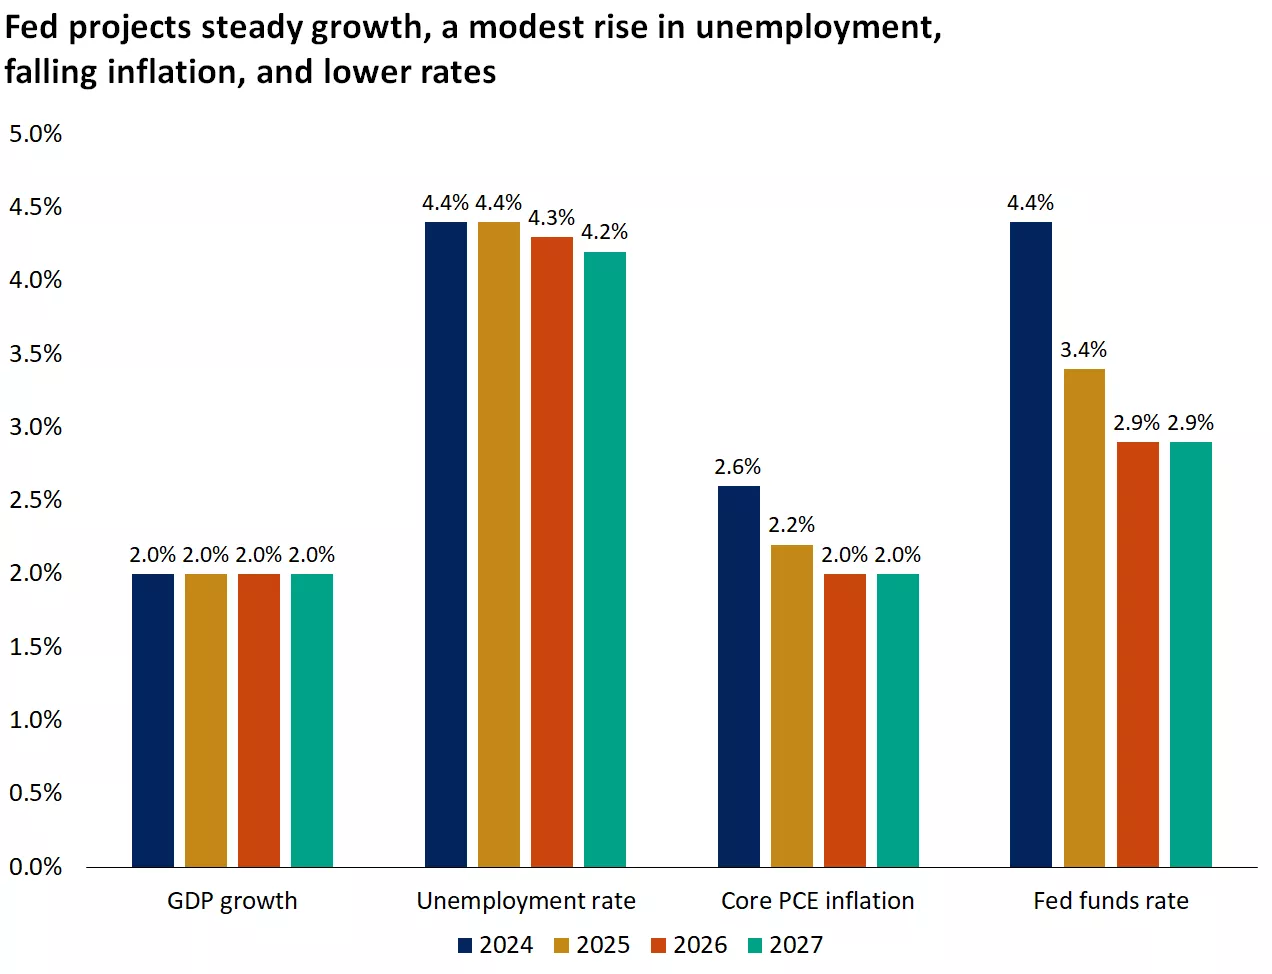
Looking forward, the Fed’s "dot plot" projections suggest additional rate cuts, aiming for a neutral rate by 2026. This gradual easing is intended not as a reaction to current economic crises but as a strategic tool to foster a more resilient economic environment. The trajectory is set to slowly peel back the restrictive measures put in place during previous tightening cycles, thus supporting a longer-term economic expansion.
Investors would do well to consider the broader implications of a lower rate environment. Fixed-income securities, particularly longer-term bonds, might become more attractive as the yields on short-term instruments decline. Additionally, the reinvestment risk associated with holding large cash positions becomes more pronounced, suggesting that extending maturity profiles in bond portfolios could be a wise strategy.
Conclusion
In conclusion, while the Fed’s recent policy move signals a potentially bullish outlook for the equity markets and broader economy, the context is nuanced by higher-than-usual valuations and a complex global economic landscape. Investors should remain vigilant, considering both the opportunities that a lower rate environment presents and the unique challenges of the current economic era. The next few years will likely require a balanced approach to investment, combining cautious optimism with a strategic response to evolving economic conditions.
Week-Over-Week Snapshots
Volatility
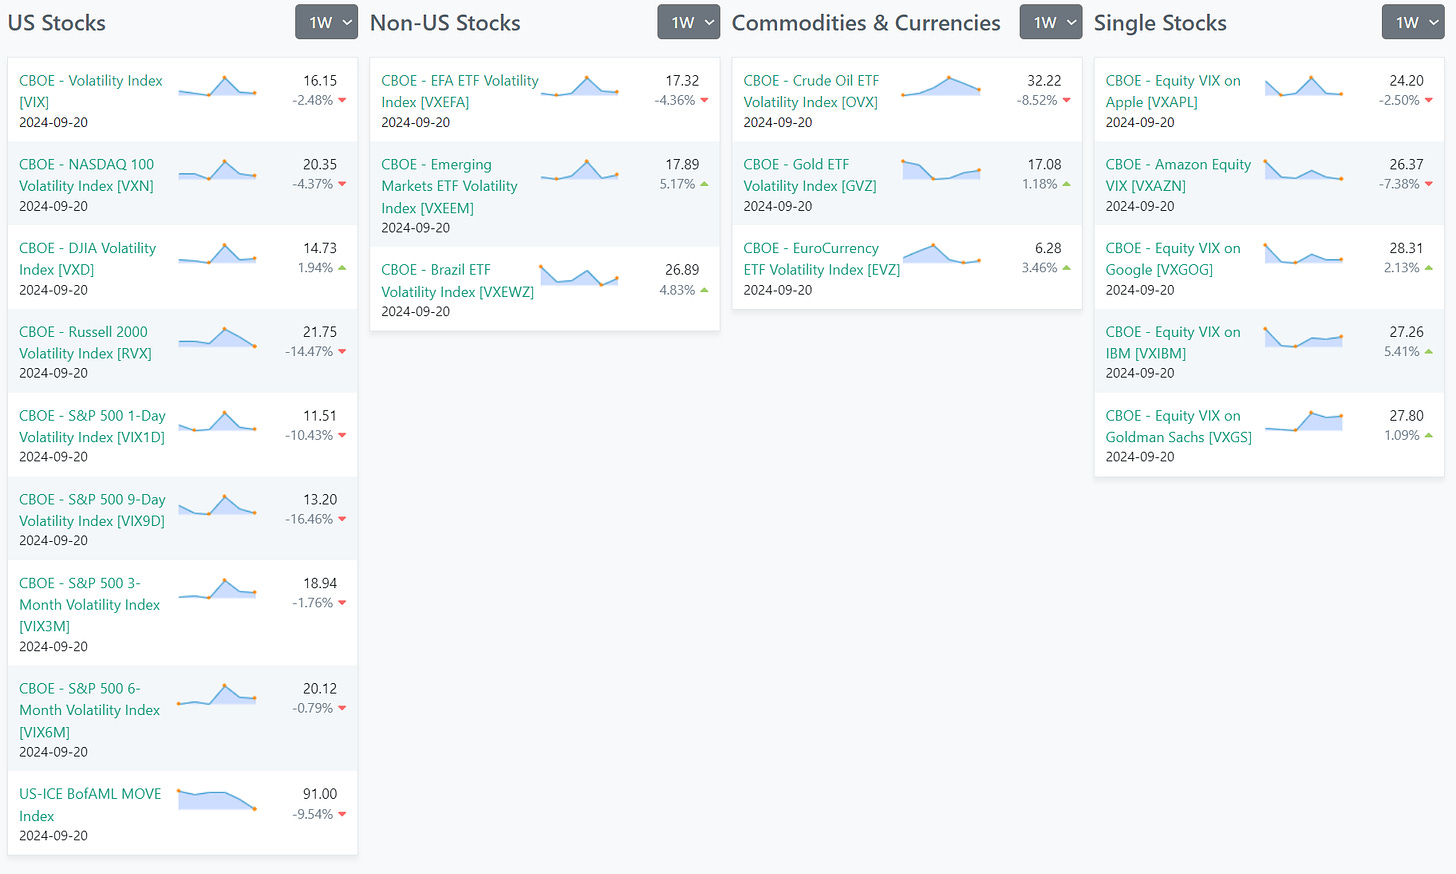
The vol snapshots reveal a nuanced landscape of volatility across various asset classes over the past week, highlighting different investor sentiments in global markets. In the U.S., there's a noticeable decline in volatility across major indices such as the NASDAQ 100 and the S&P 500, signaling a period of stabilization and growing confidence among U.S. equity investors. Conversely, non-U.S. stocks exhibit mixed responses; Brazilian equities, for instance, show a marked increase in volatility, indicating rising uncertainties or risk perceptions among investors. Similarly, emerging markets have seen an uptick in volatility, suggesting a cautious or tentative investor stance. In the realm of commodities and currencies, there is a divergence in movement with crude oil volatility sharply decreasing, while gold shows a slight increase, reflecting fluctuating investor sentiment and economic outlooks. Meanwhile, the EuroCurrency experiences increased volatility suggest keeping an eye on news from the Eurozone.
ETFs
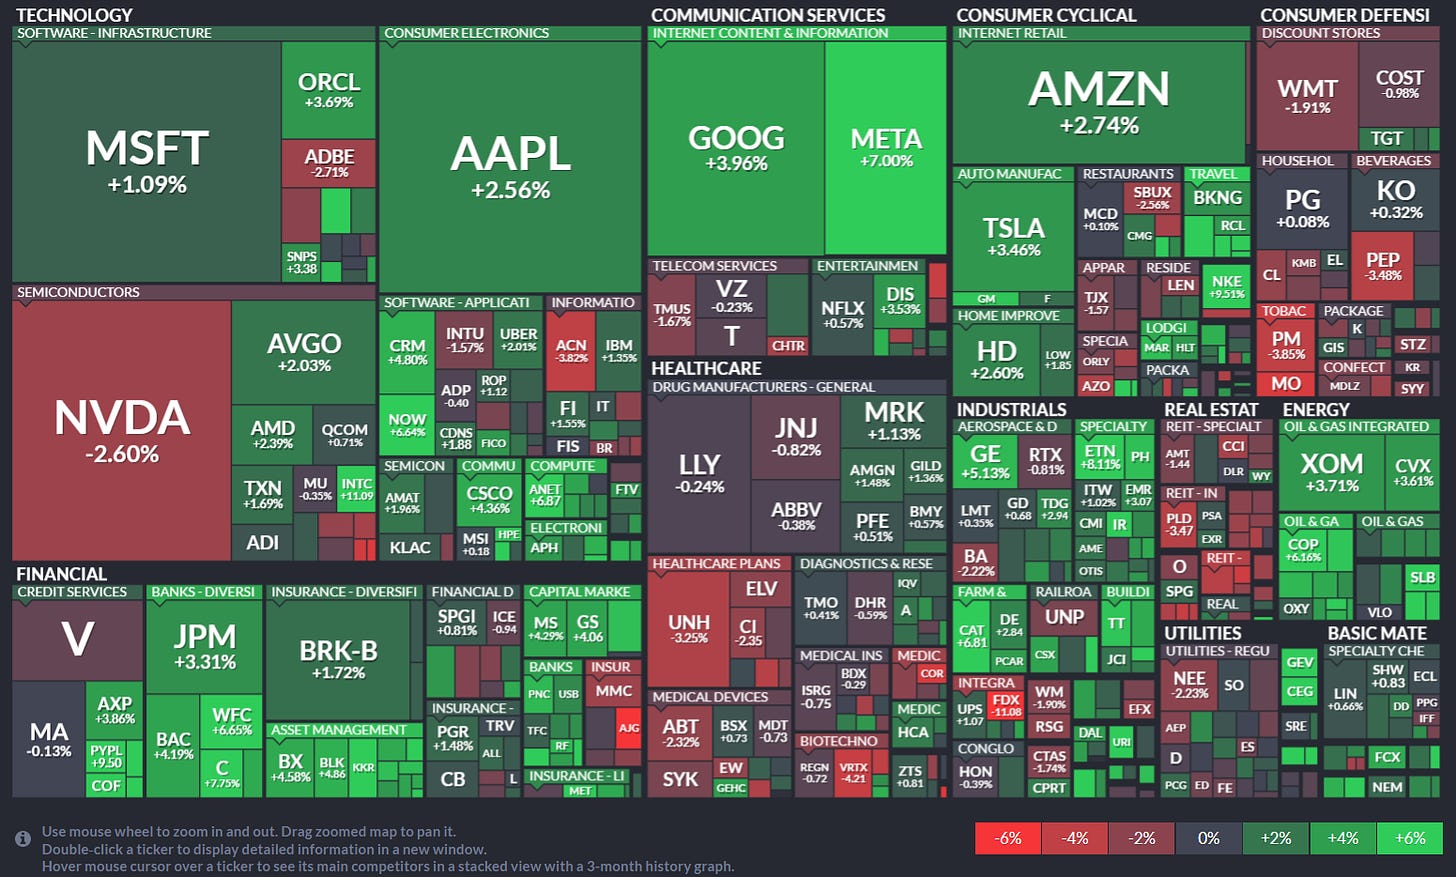
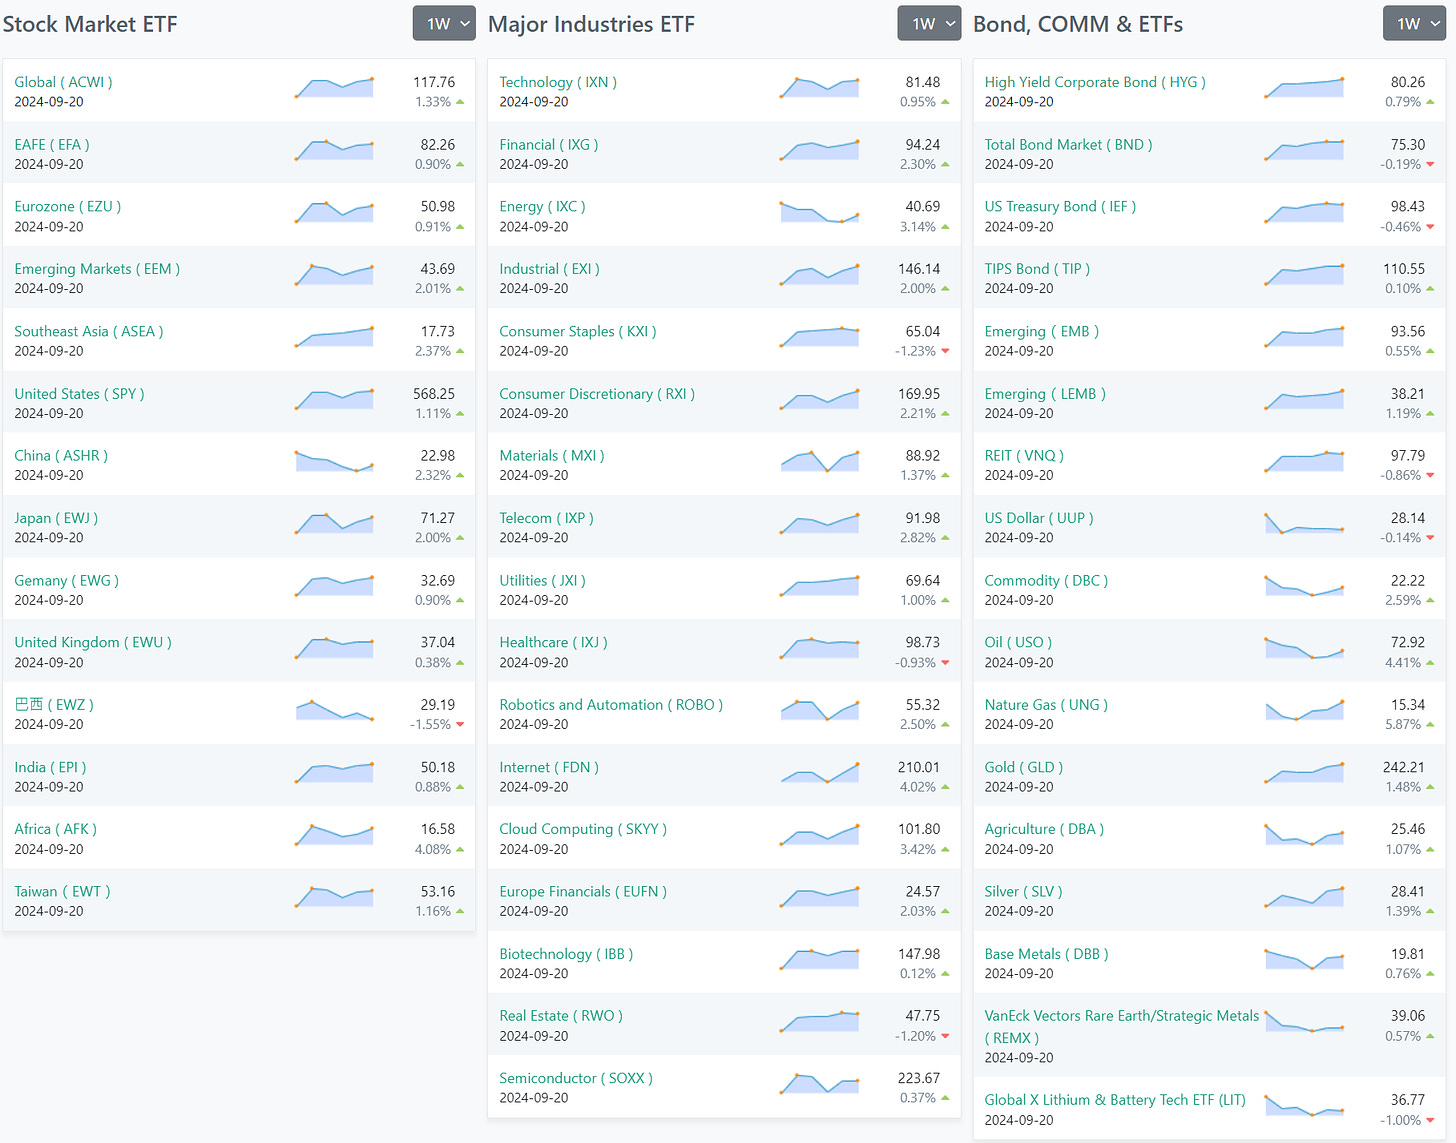
Stock Market ETFs show a mix of performances across different regions. Notable are the gains in Southeast Asia and the United States, suggesting a positive sentiment. Conversely, China and Brazil have shown declines, potentially indicating regional economic challenges or investor sentiment worth digging into.
Major Industries ETFs reveal significant growth in sectors like Robotics and Automation, Cloud Computing, and Internet, reflecting a strong investor confidence in technology and automation as driving forces for future growth. However, there is a slight decline in sectors like Healthcare and Real Estate, which might suggest sector-specific challenges or shifts in investment focus.
Bonds, Commodities, and other ETFs category showcases stability in US Treasury Bonds and a rise in commodities like Natural Gas and Agriculture.
Crypto
Forex
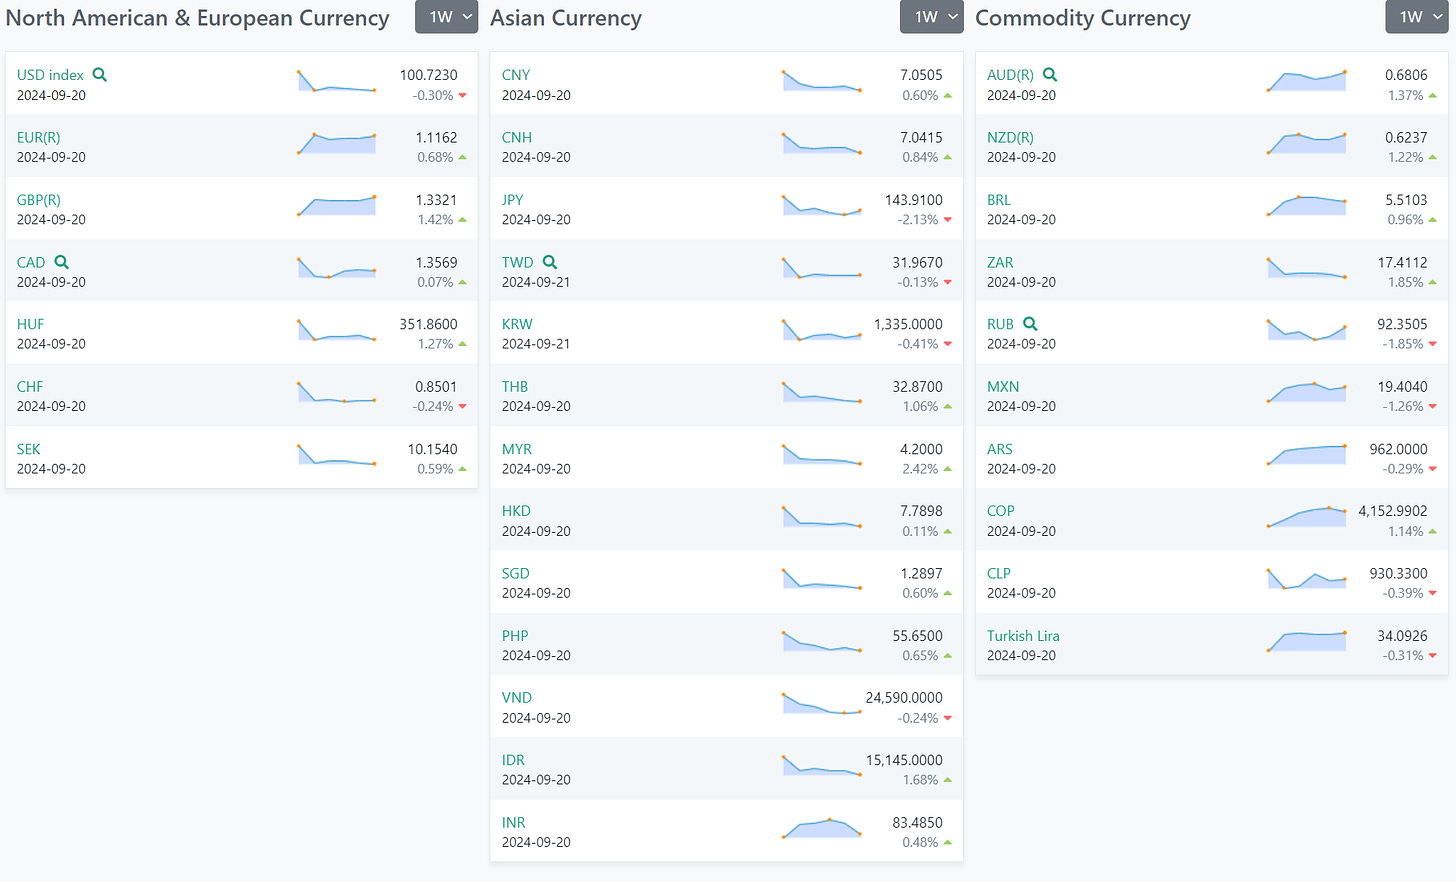
The recent weekly changes in various currency exchange rates reveal a landscape of heightened volatility and regional economic signals that are pivotal for investors to consider. Significant movement in key currencies such as the British Pound and the Euro, which are showing appreciation, might suggest a backdrop of economic stability or positive market sentiment in Europe. Meanwhile, the notable fluctuations in emerging market currencies like the Russian Ruble and the Indonesian Rupiah could be indicative of underlying economic or political events that require close monitoring. Additionally, commodity-linked currencies such as the Australian and Canadian Dollars also display movements that may be tied to shifts in commodity prices, presenting both risks and opportunities.
US Investor Sentiment
%Bull-Bear Spread
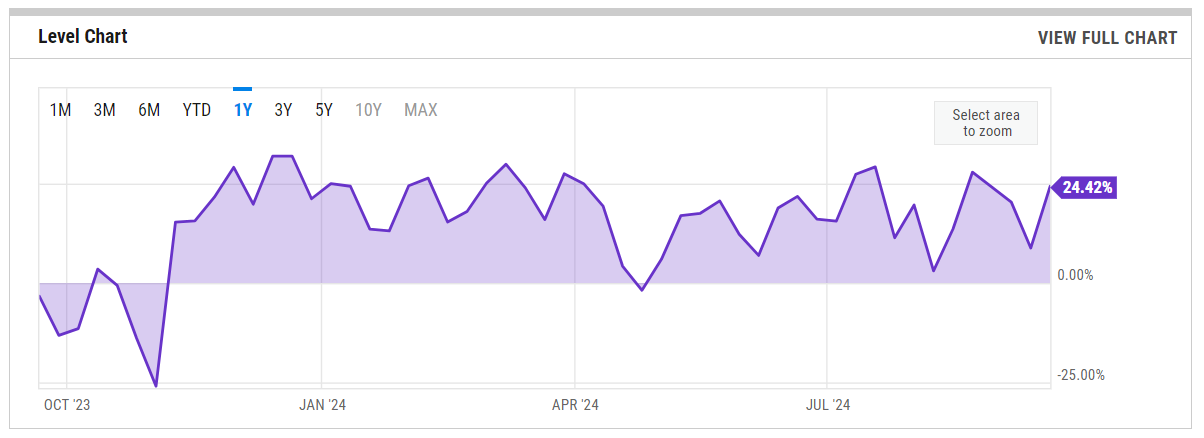
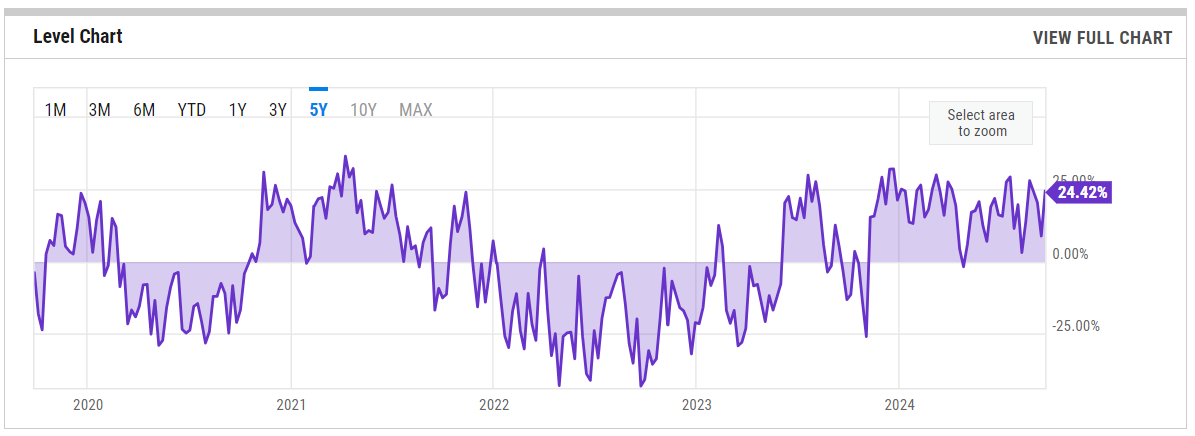
% Bull-Bear Spread is at 24.42%, compared to 8.84% last week and 5.19% last year. This is higher than the long-term average of 6.70%.
1-Year View
5-Year View
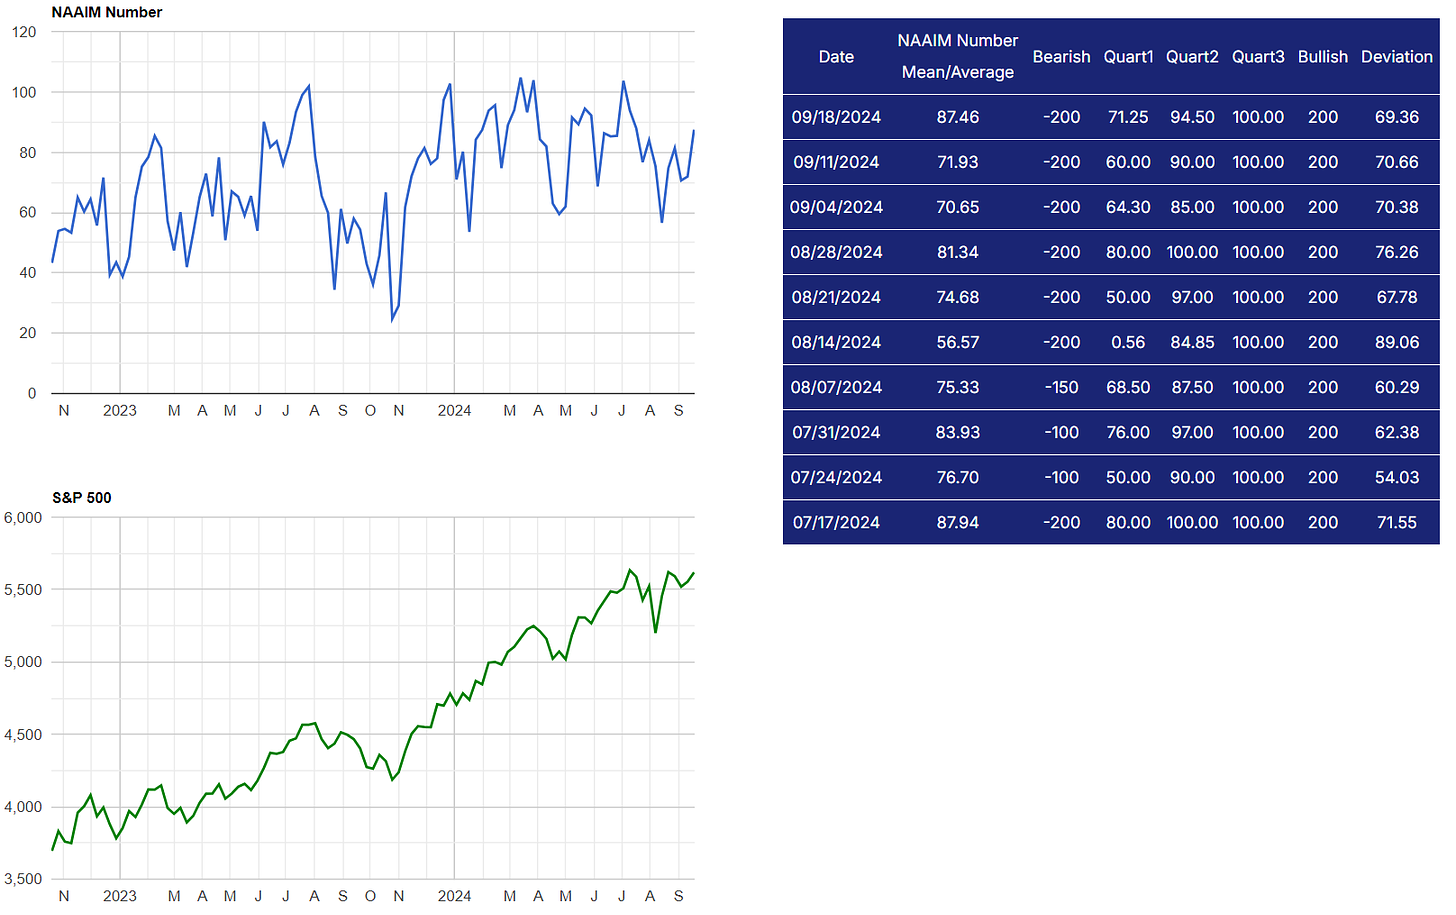
NAAIM Exposure Index
The NAAIM Exposure Index (National Association of Active Investment Managers Exposure Index) measures the average exposure to U.S. equity markets as reported by its member firms. These are typically active money managers who provide their equity exposure levels weekly. The index offers insight into how much these managers are investing in equities at any given time, ranging from being fully short (-100%) to leveraged long (up to +200%).
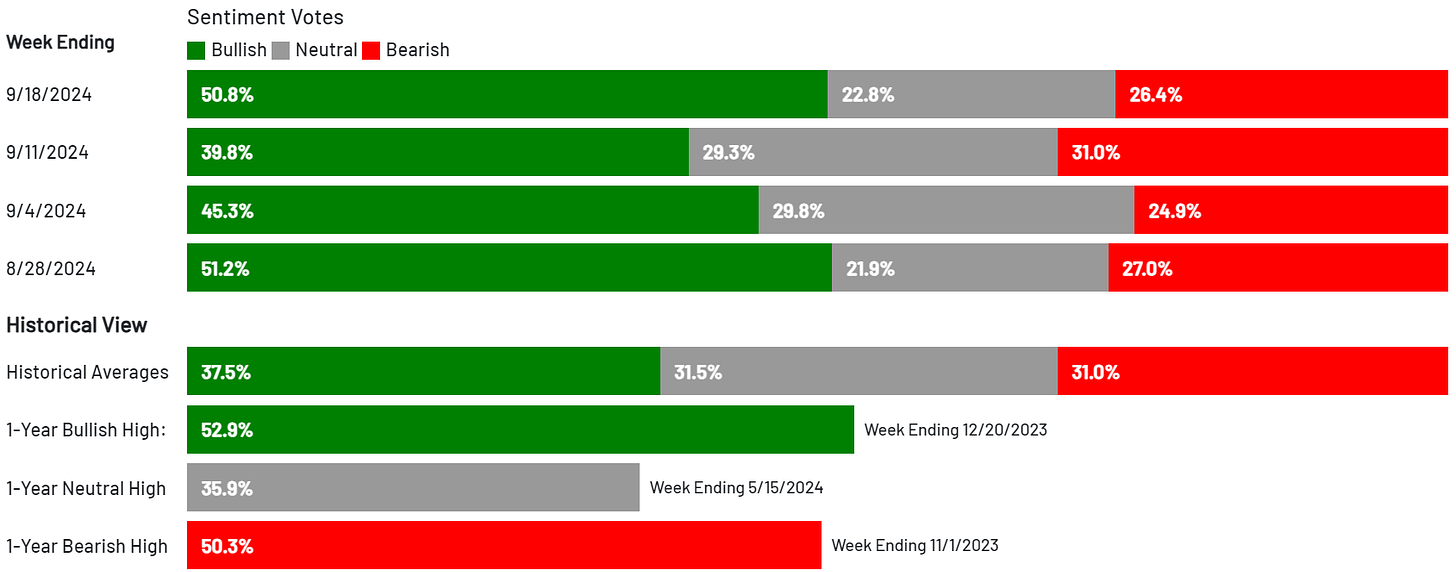
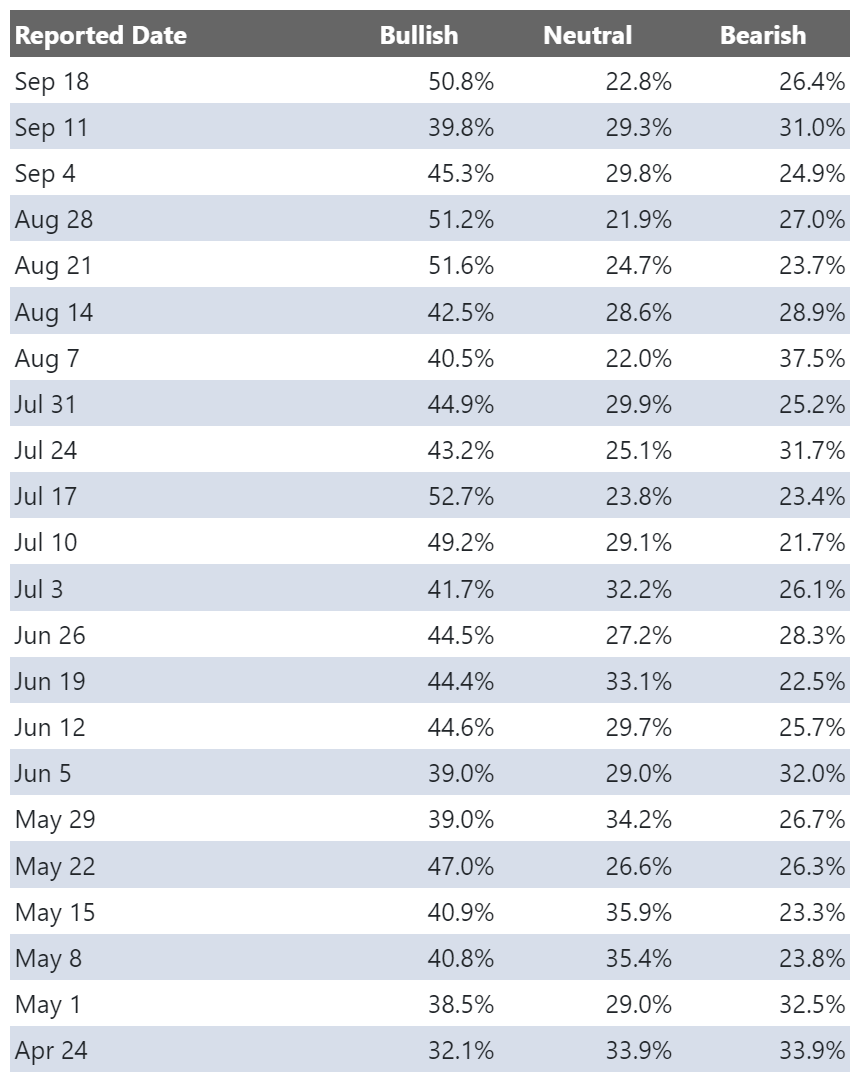
AAII Investor Sentiment Survey
The AAII Investor Sentiment Survey is a weekly survey conducted by the American Association of Individual Investors (AAII) to gauge the mood of individual investors regarding the direction of the stock market over the next six months. It provides insights into whether investors are feeling bullish (expecting the market to rise), bearish (expecting the market to fall), or neutral (expecting the market to stay about the same).
Key Points:
Bullish Sentiment: Reflects the percentage of investors who believe the stock market will rise in the next six months.
Bearish Sentiment: Represents those who expect a decline.
Neutral Sentiment: Reflects investors who anticipate little to no market movement.
The survey is widely followed as a contrarian indicator, meaning that extreme levels of bullishness or bearishness can sometimes signal market turning points. For example, when a large number of investors are overly optimistic (high bullish sentiment), it could suggest a market top, while excessive pessimism (high bearish sentiment) may indicate a market bottom is near.
SPX Put/Call Ratio
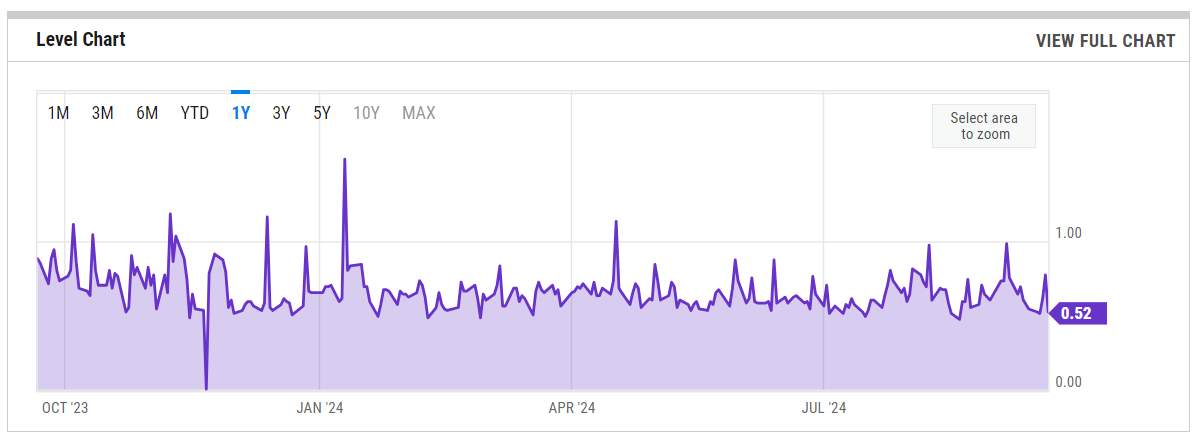
1-Year View
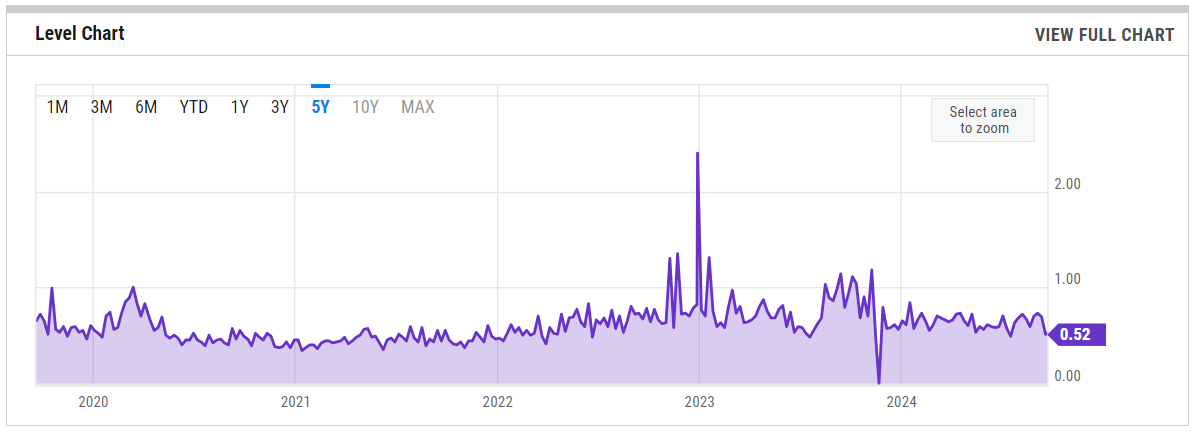
5-Year View
CBOE Equity Put/Call Ratio
1-Year View
5-Year View
ISEE Sentiment Index
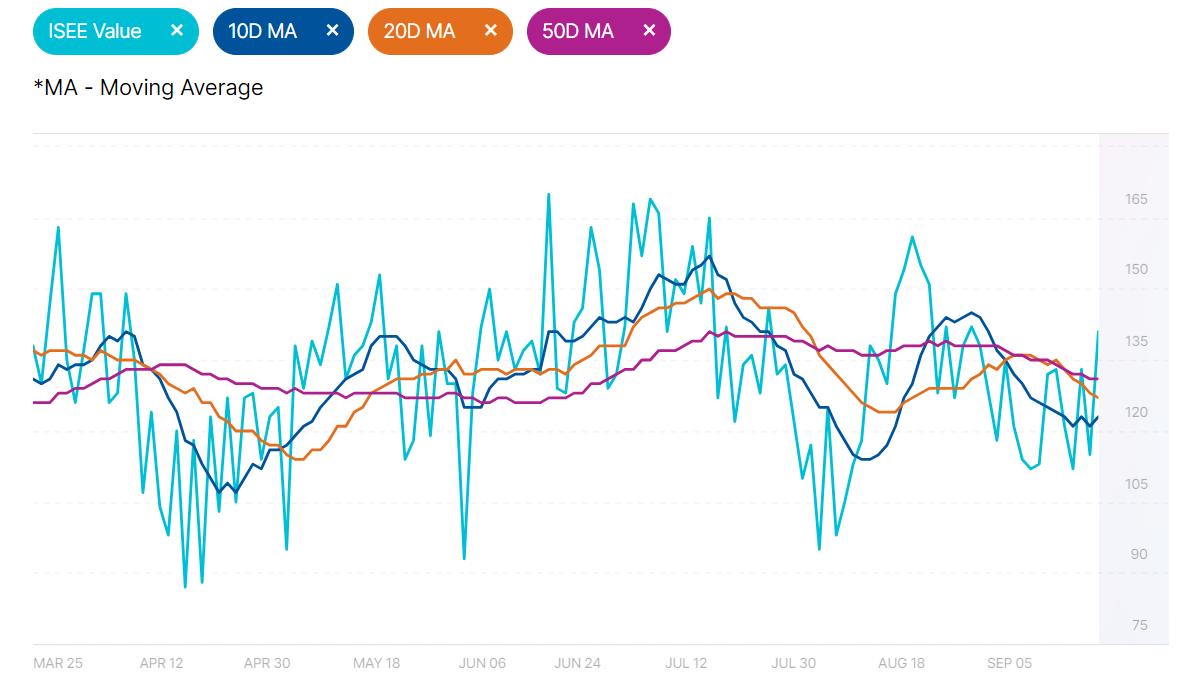
The ISEE (International Securities Exchange Sentiment) Index is a measure of investor sentiment derived from options trading. Unlike traditional put/call ratios, the ISEE Index focuses only on opening long customer transactions and is adjusted to remove market-maker and firm trades, providing a purer sentiment reading.
The ISEE Index typically ranges from 0 to 200, with readings above 100 indicating more call options being bought relative to put options, suggesting bullish sentiment. Conversely, readings below 100 suggest bearish sentiment, with more puts being purchased relative to calls.
New Highs - New Lows
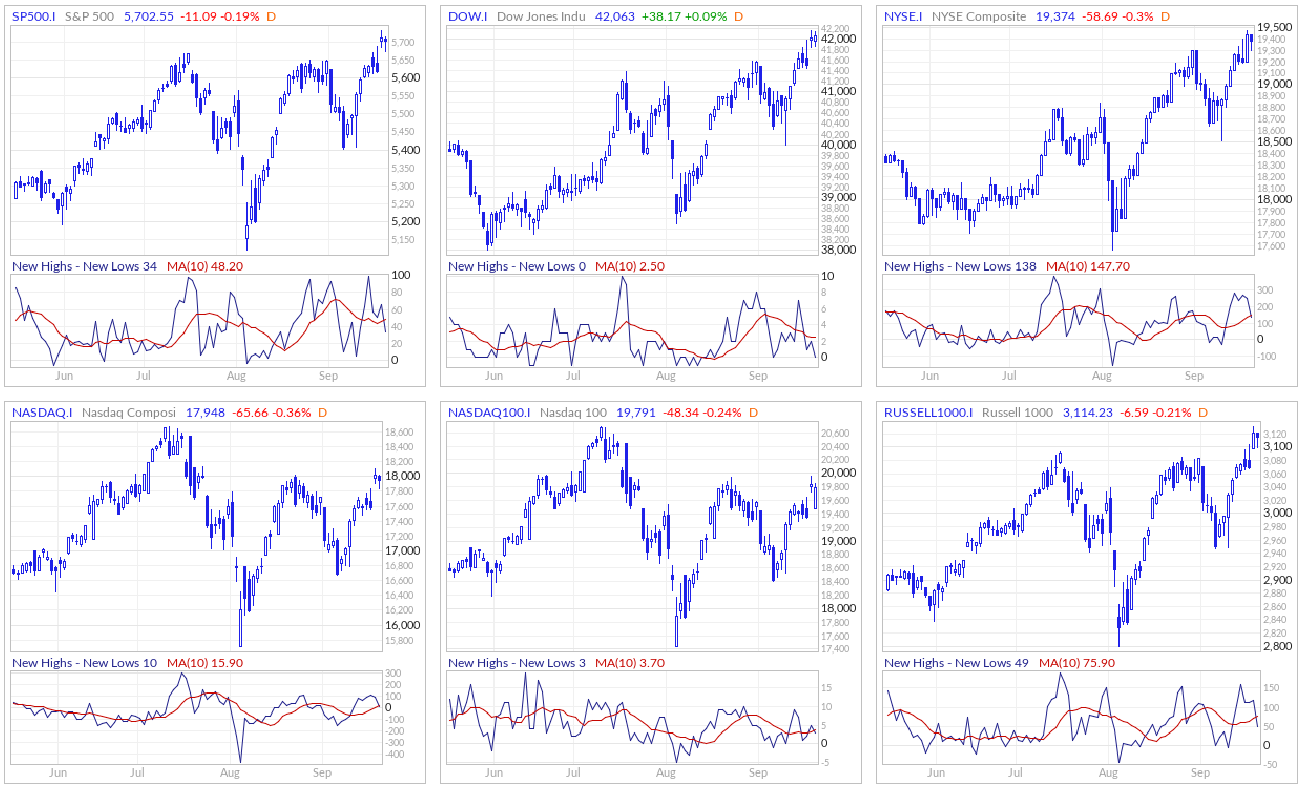
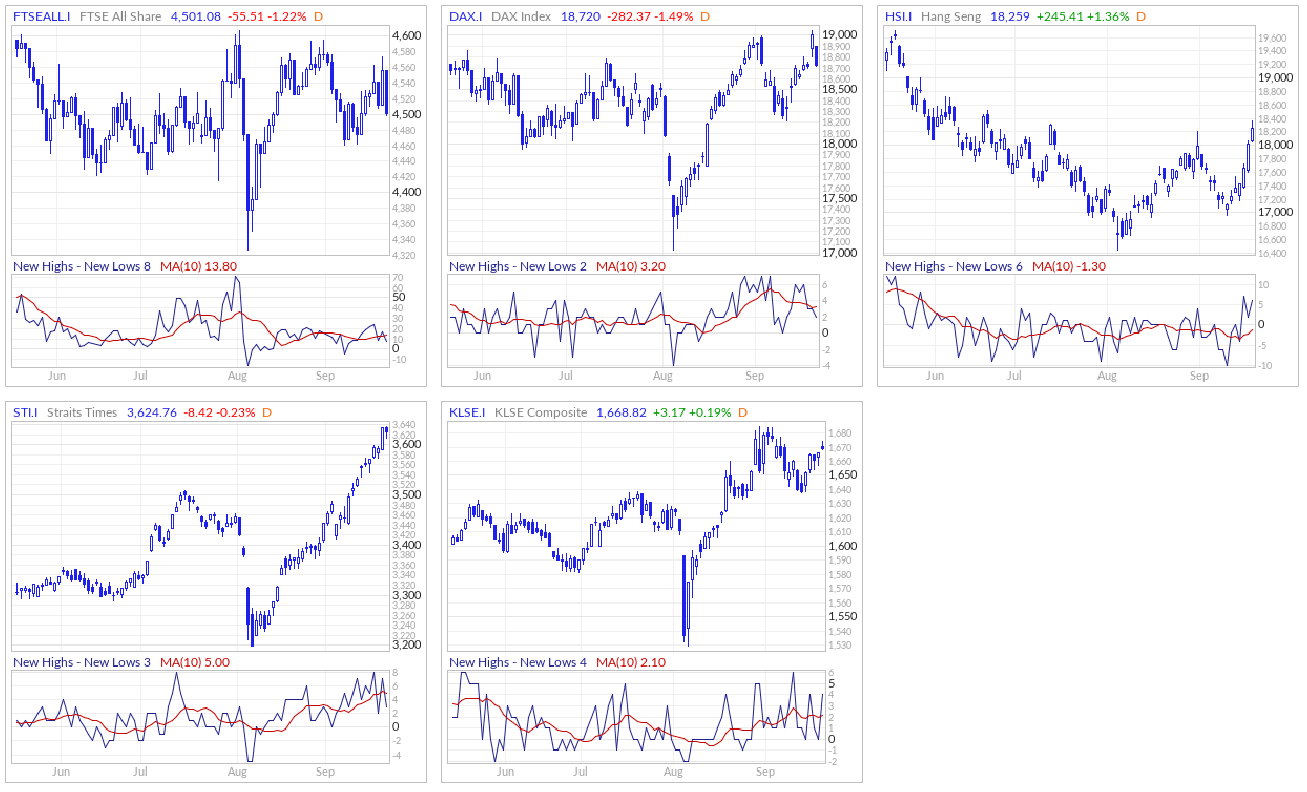
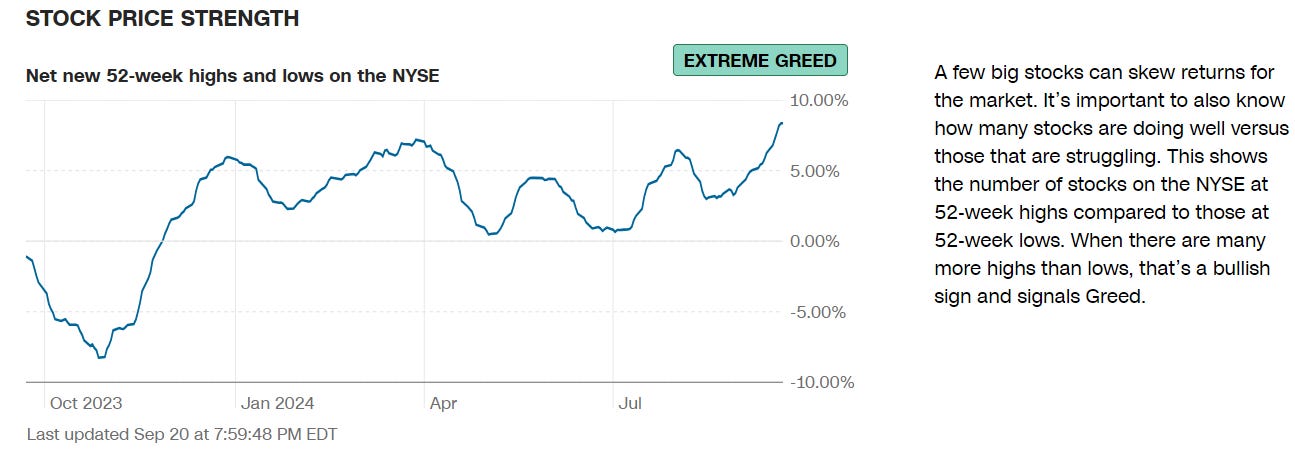
The New Highs - New Lows indicator (NH-NL) displays the daily difference between the number of stocks reaching new 52-week highs and the number of stocks reaching new 52-week lows. The NH-NL indicator generally reaches its extreme lows slightly before a major market bottom. As the market then turns up from the major bottom, the indicator jumps up rapidly. During this period, many new stocks are making new highs because it's easy to make a new high when prices have been depressed for a long time. The NH-NL indicator oscillates around zero. If the indicator is positive, the bulls are in control. If it is negative, the bears are in control. As the cycle matures, a divergence often occurs as fewer and fewer stocks are making new highs (the indicator falls), yet the market indices continue to reach new highs. This is a classic bearish divergence that indicates that the current upward trend is weak and may reverse.
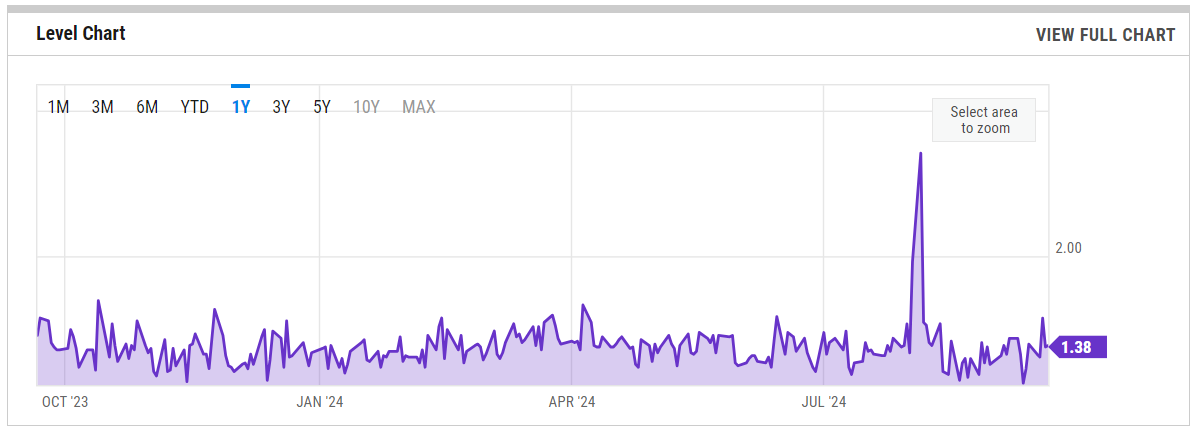
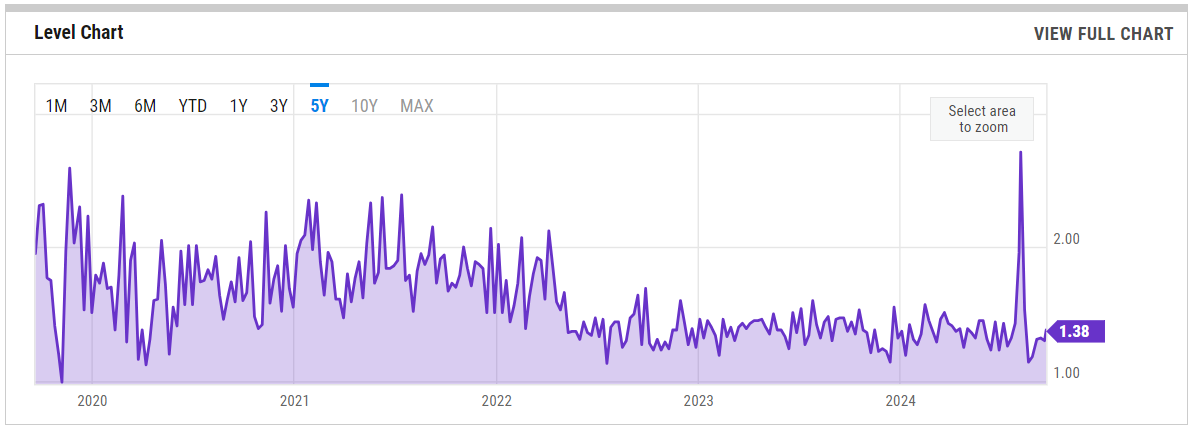
ARMS Index
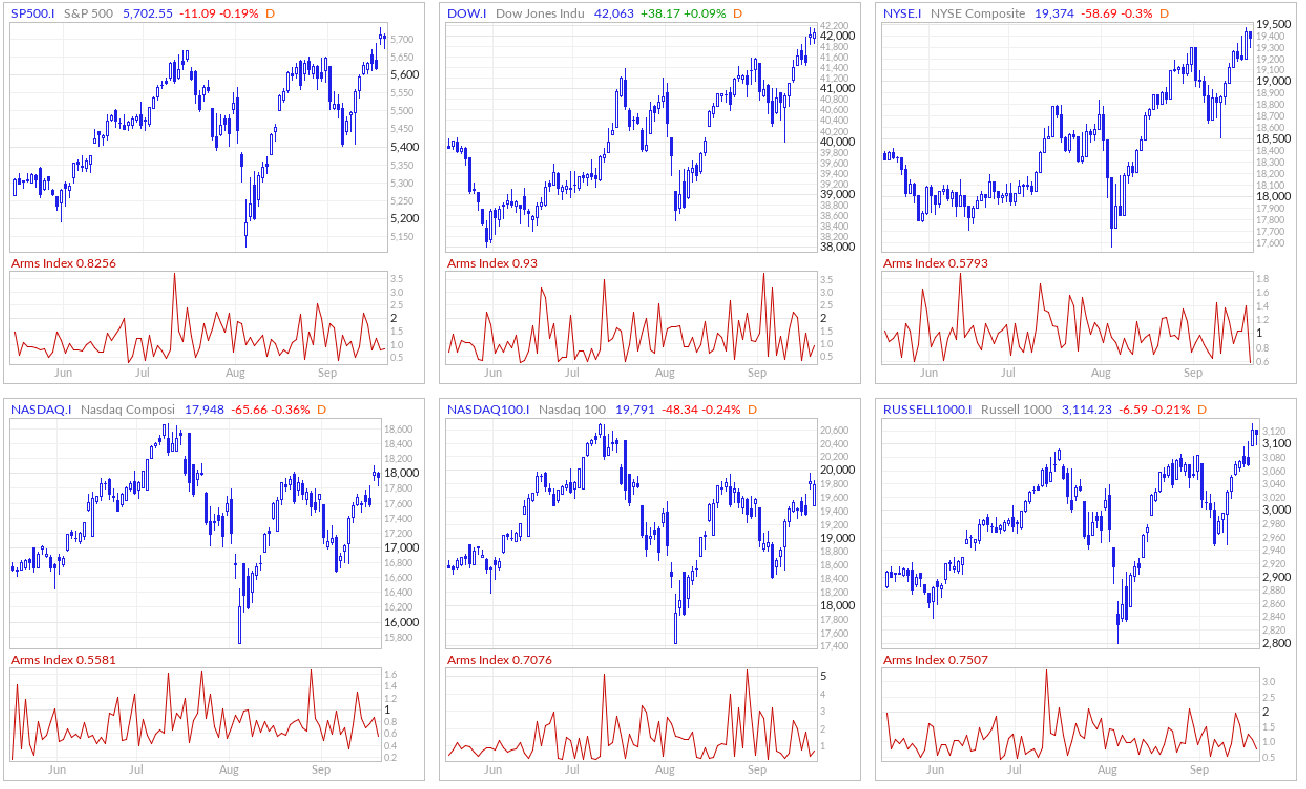
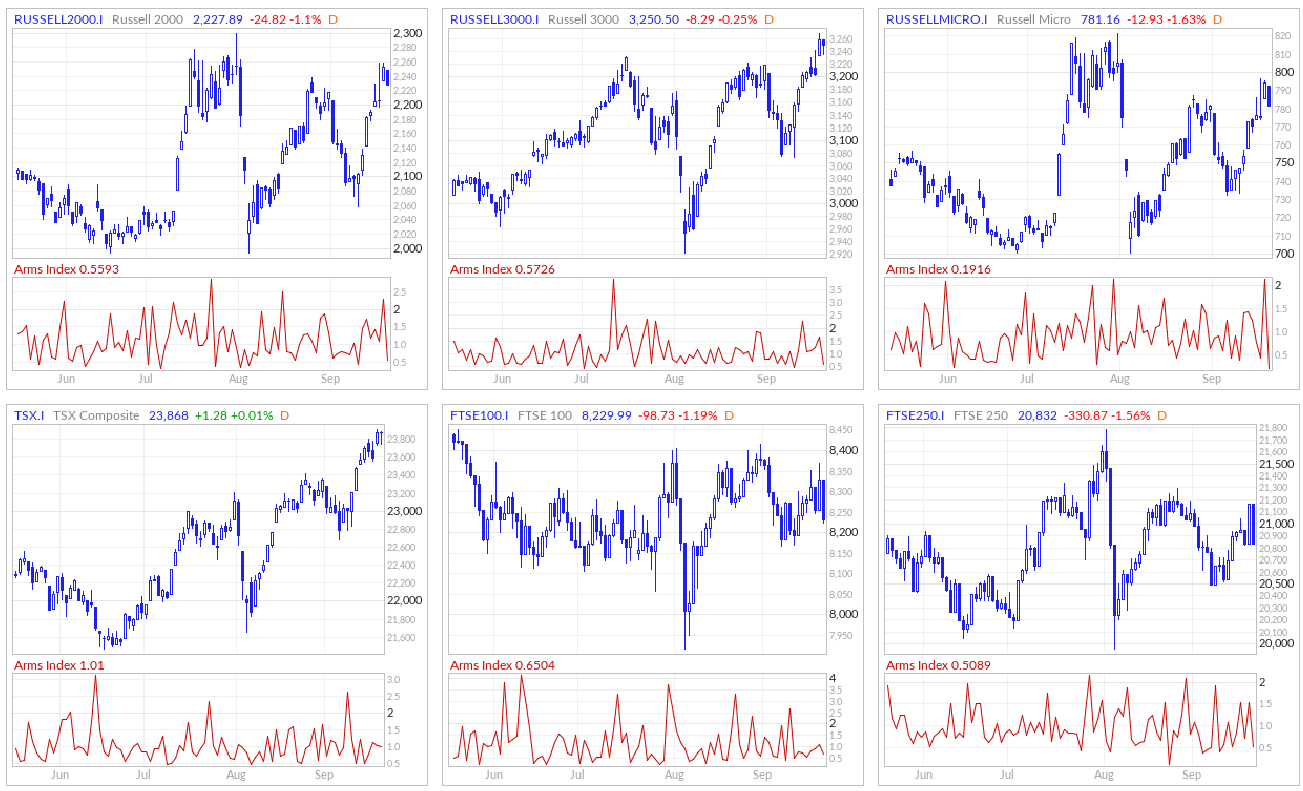
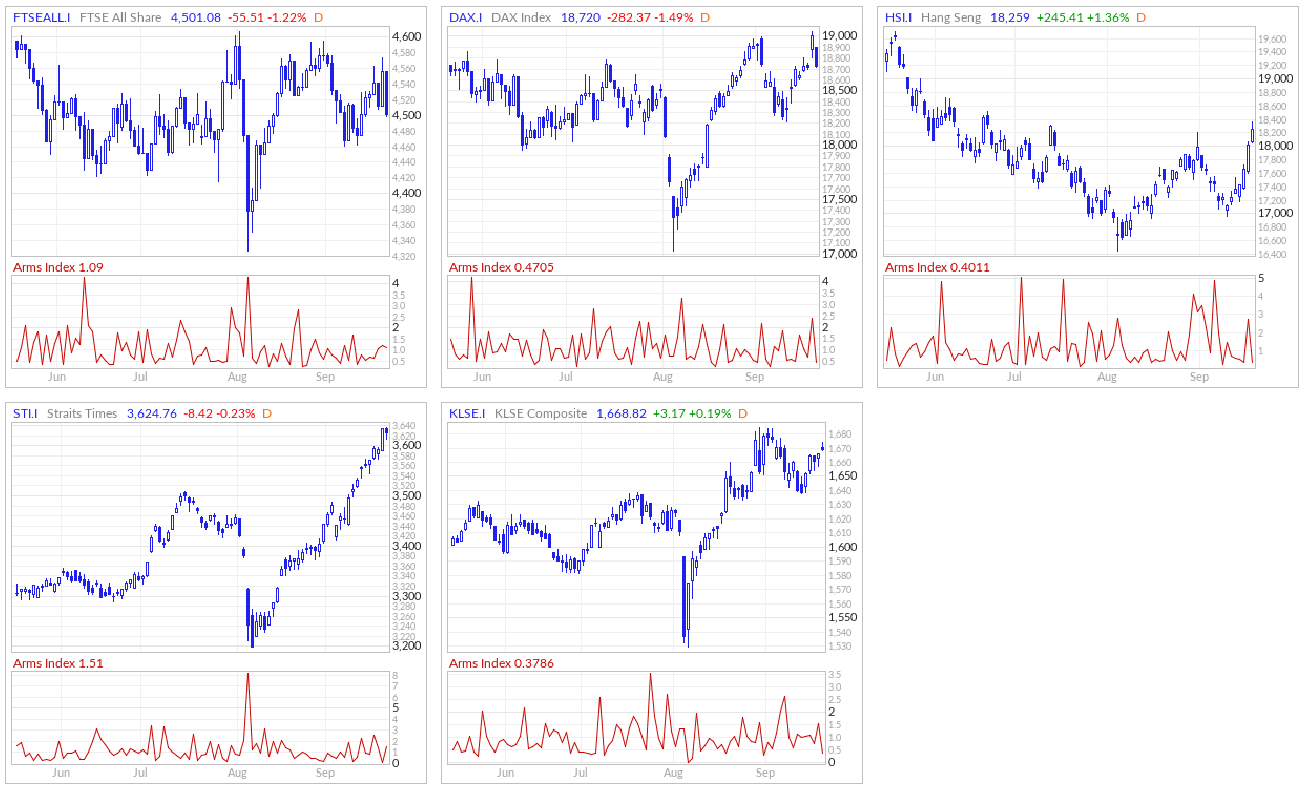
The Arms Index, also known as the TRIN (Short-Term TRading INdex), was developed by Richard Arms in the 1960s. It is calculated by dividing the ratio of advancing stocks to declining stocks by the ratio of advancing volume to declining volume. Interpreting the Arms Index involves looking at its value in relation to certain thresholds. A value below "1" is considered bullish, indicating that advancing stocks and volume dominate the market. Conversely, a value above "1" is considered bearish, suggesting that declining stocks and volume are more prevalent. Extremely low values (below 0.5) or high values (above 2) are often seen as potential reversal signals.
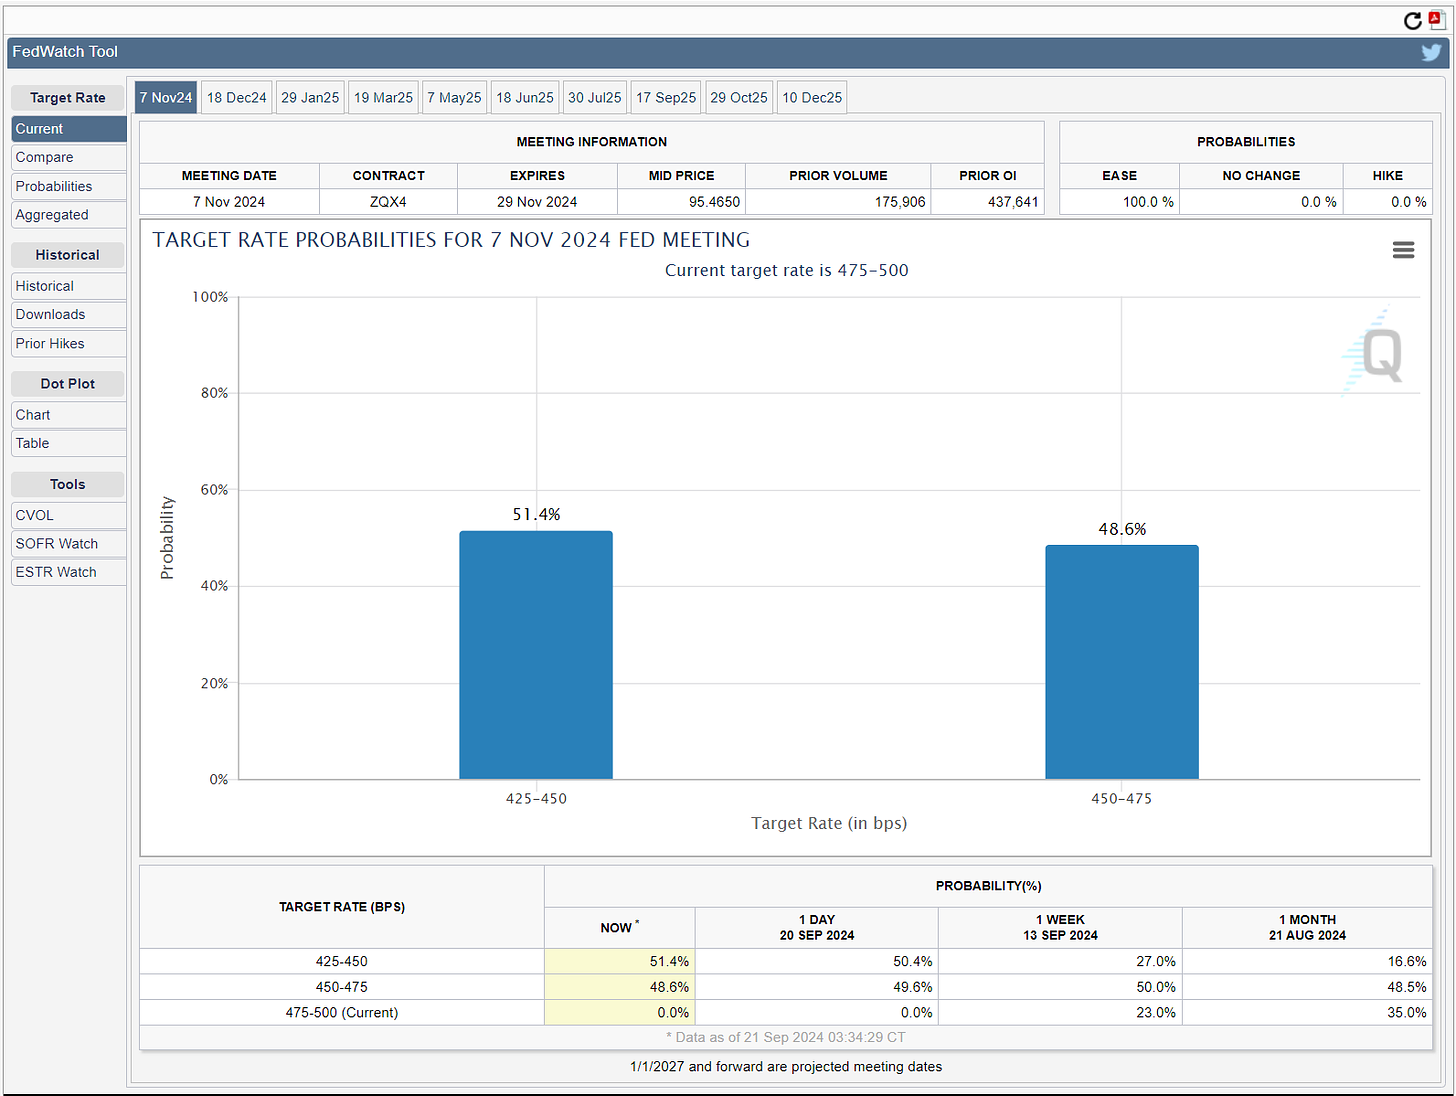
CME Fedwatch
What is the likelihood that the Fed will change the Federal target rate at upcoming FOMC meetings, according to interest rate traders? Use CME FedWatch to track the probabilities of changes to the Fed rate, as implied by 30-Day Fed Funds futures prices.
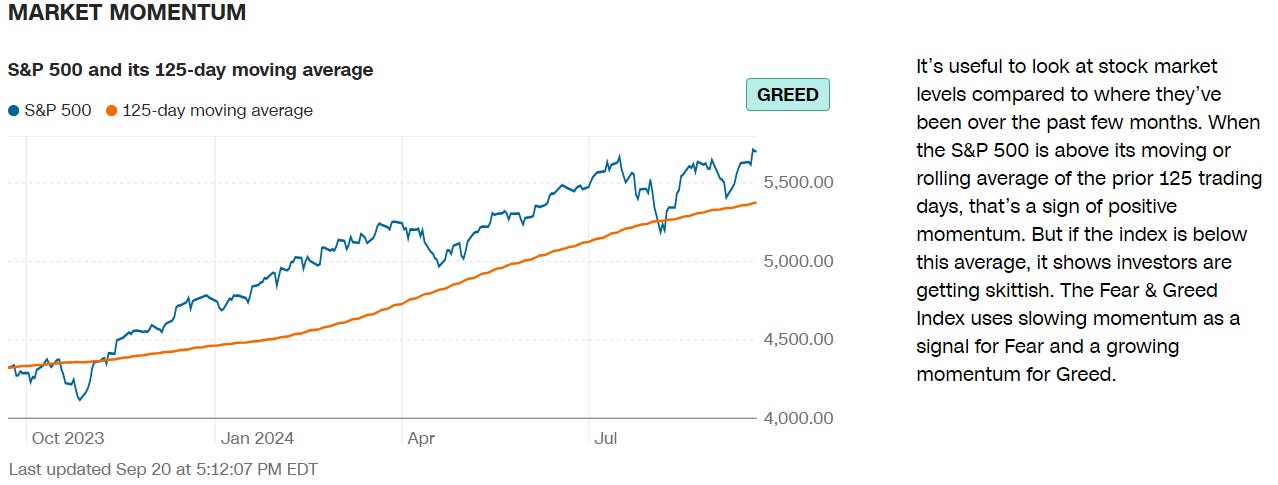
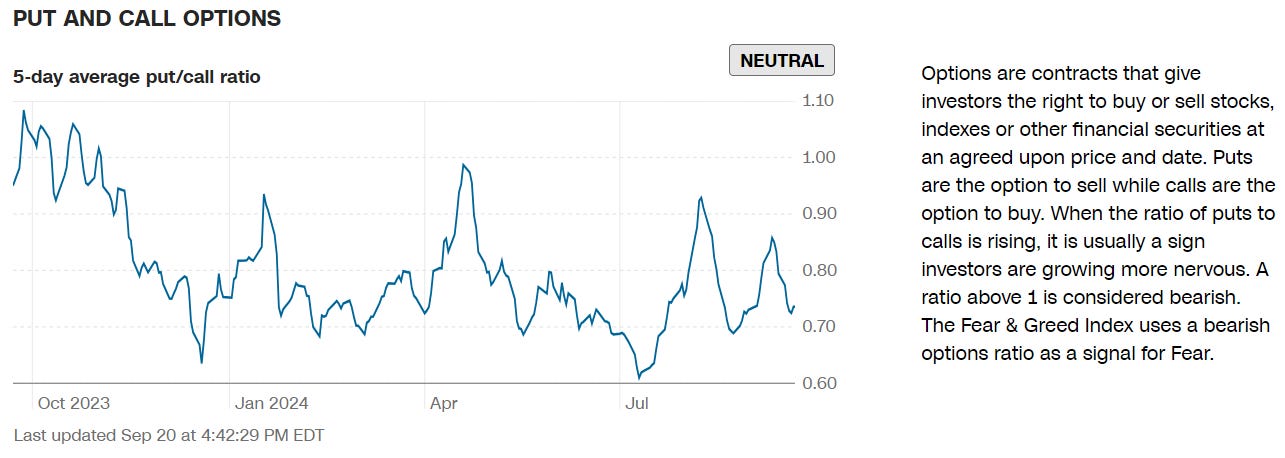
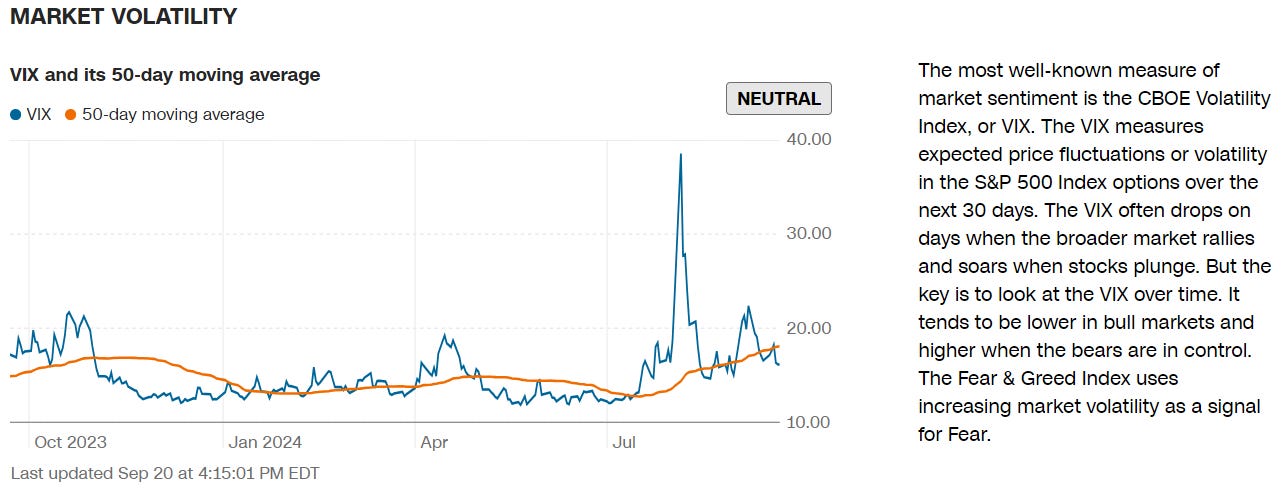
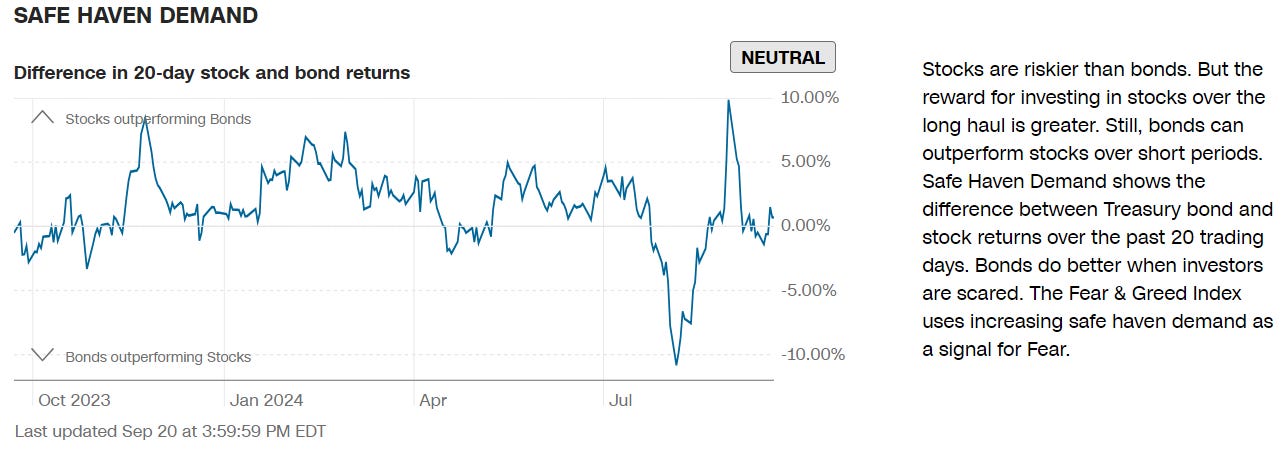
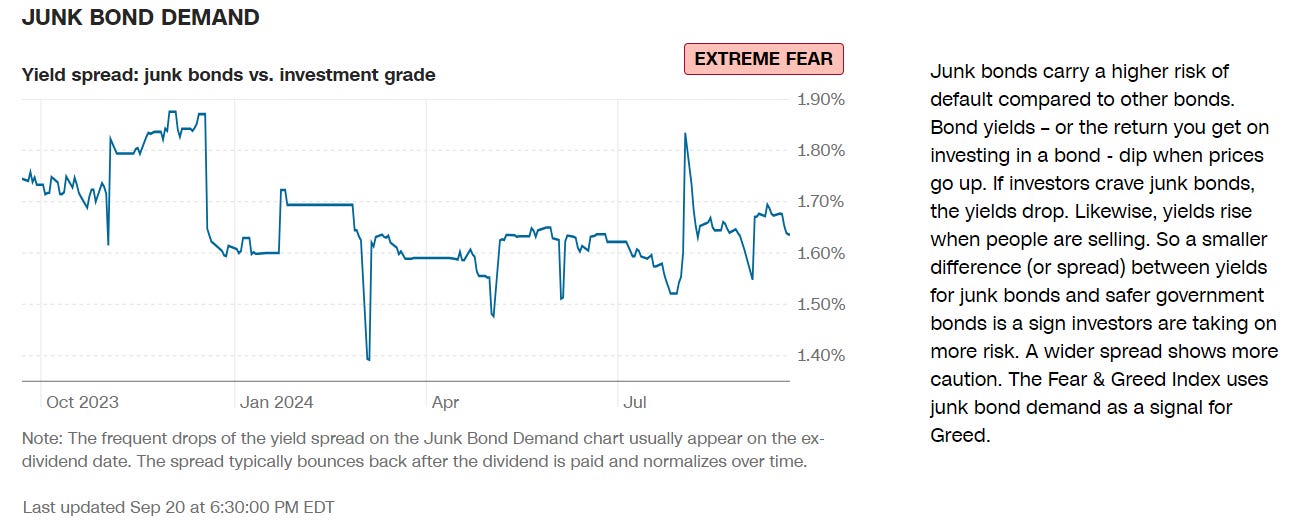
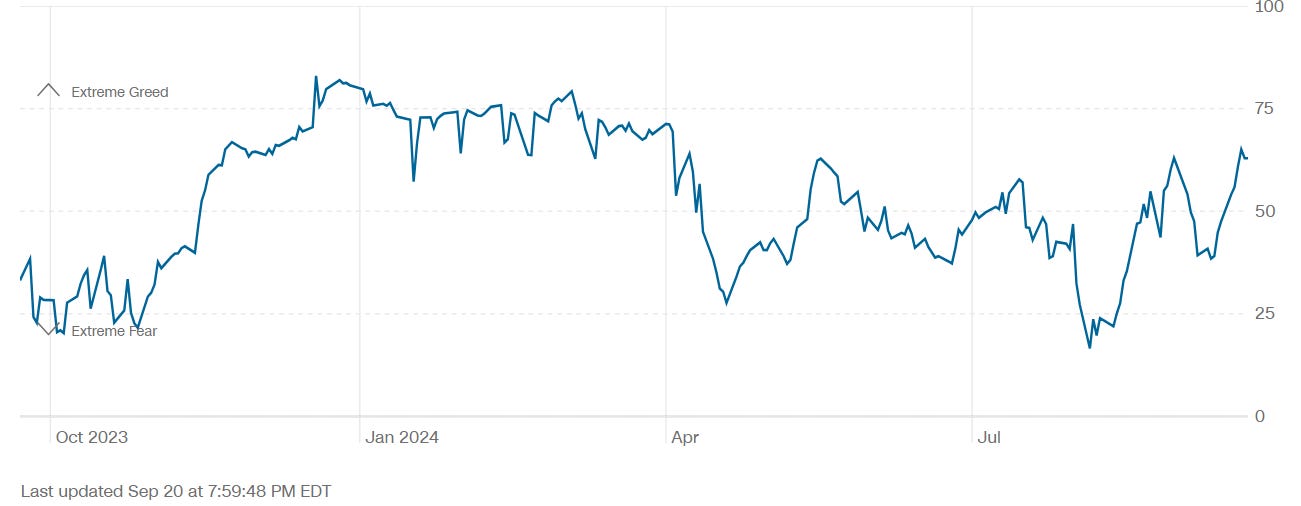
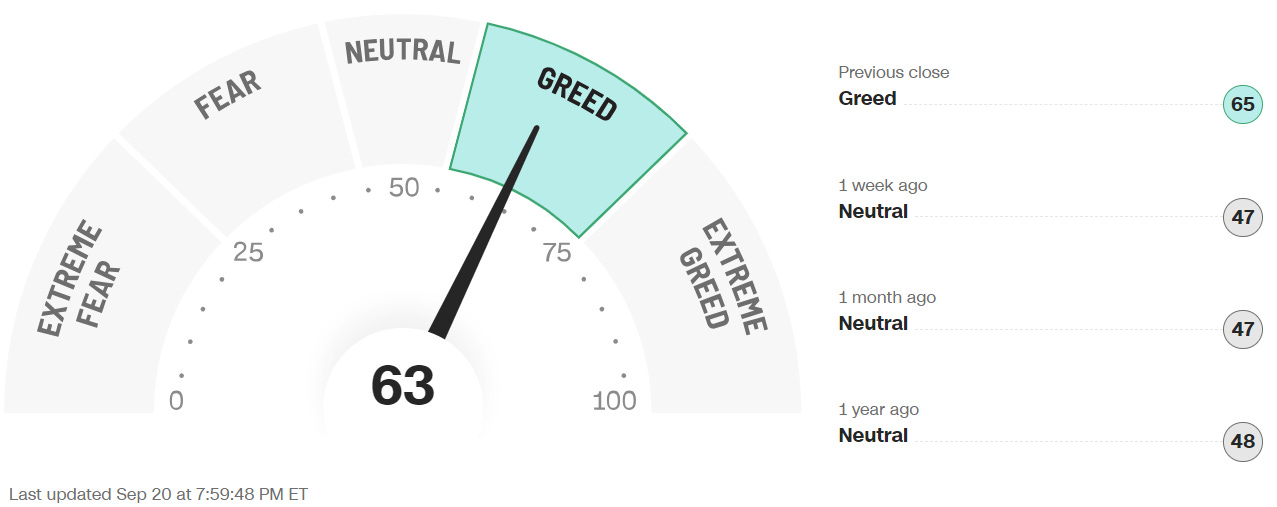
CNN 7 Fear & Greed Constituent Data Points + Composite Index
Final Composite Fear & Greed Index Reading
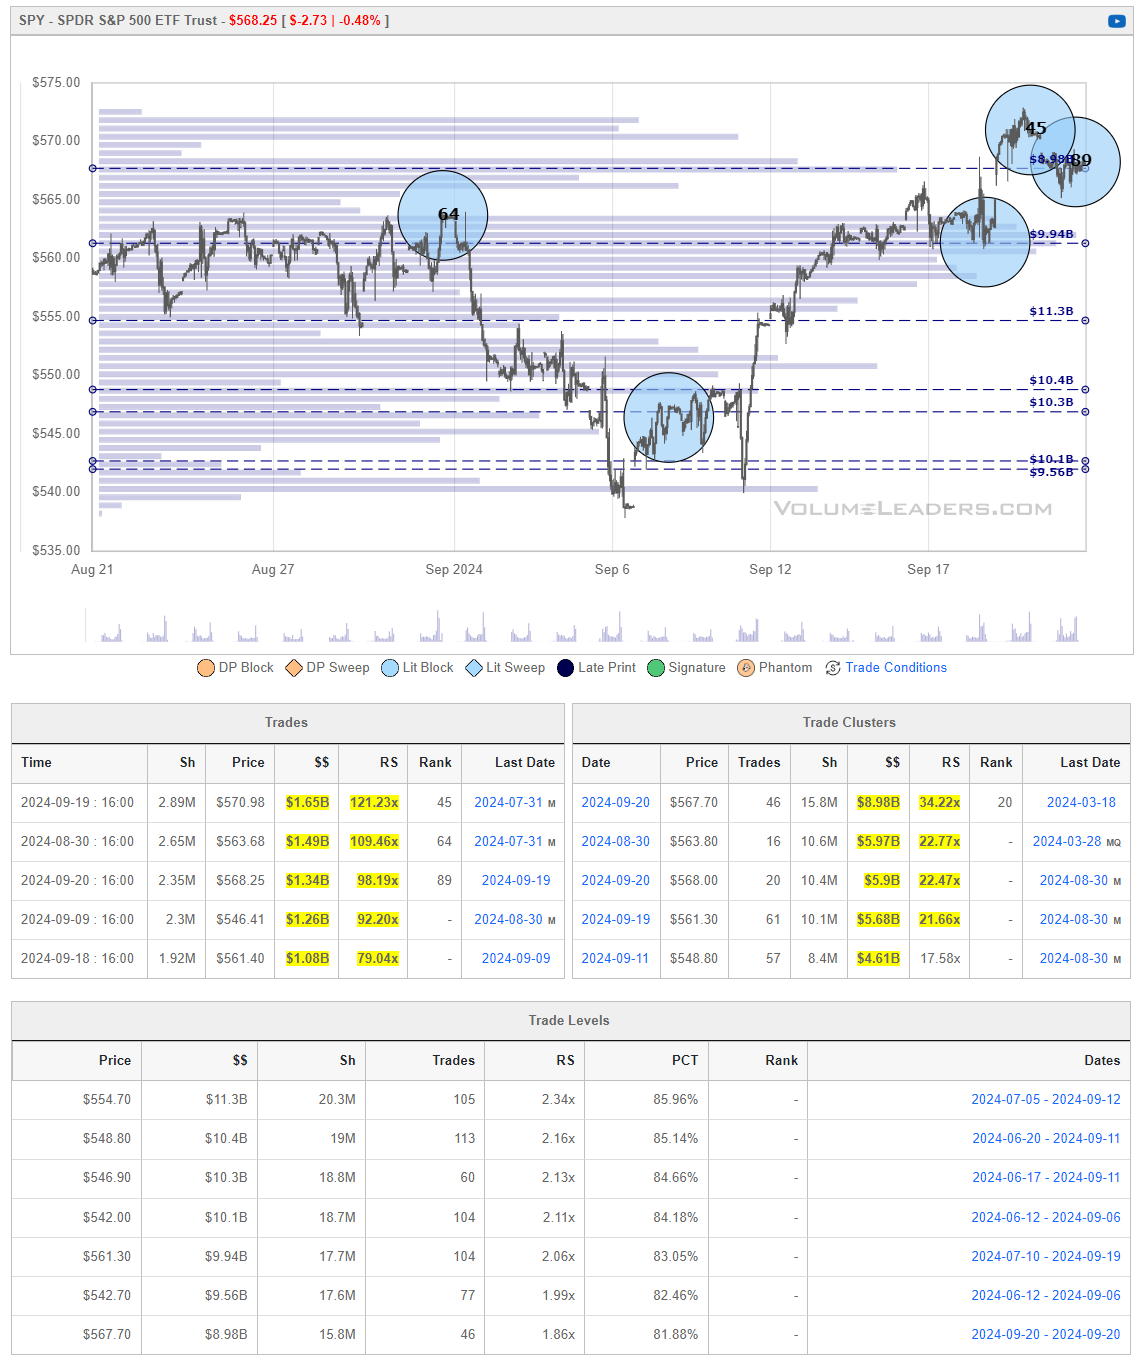
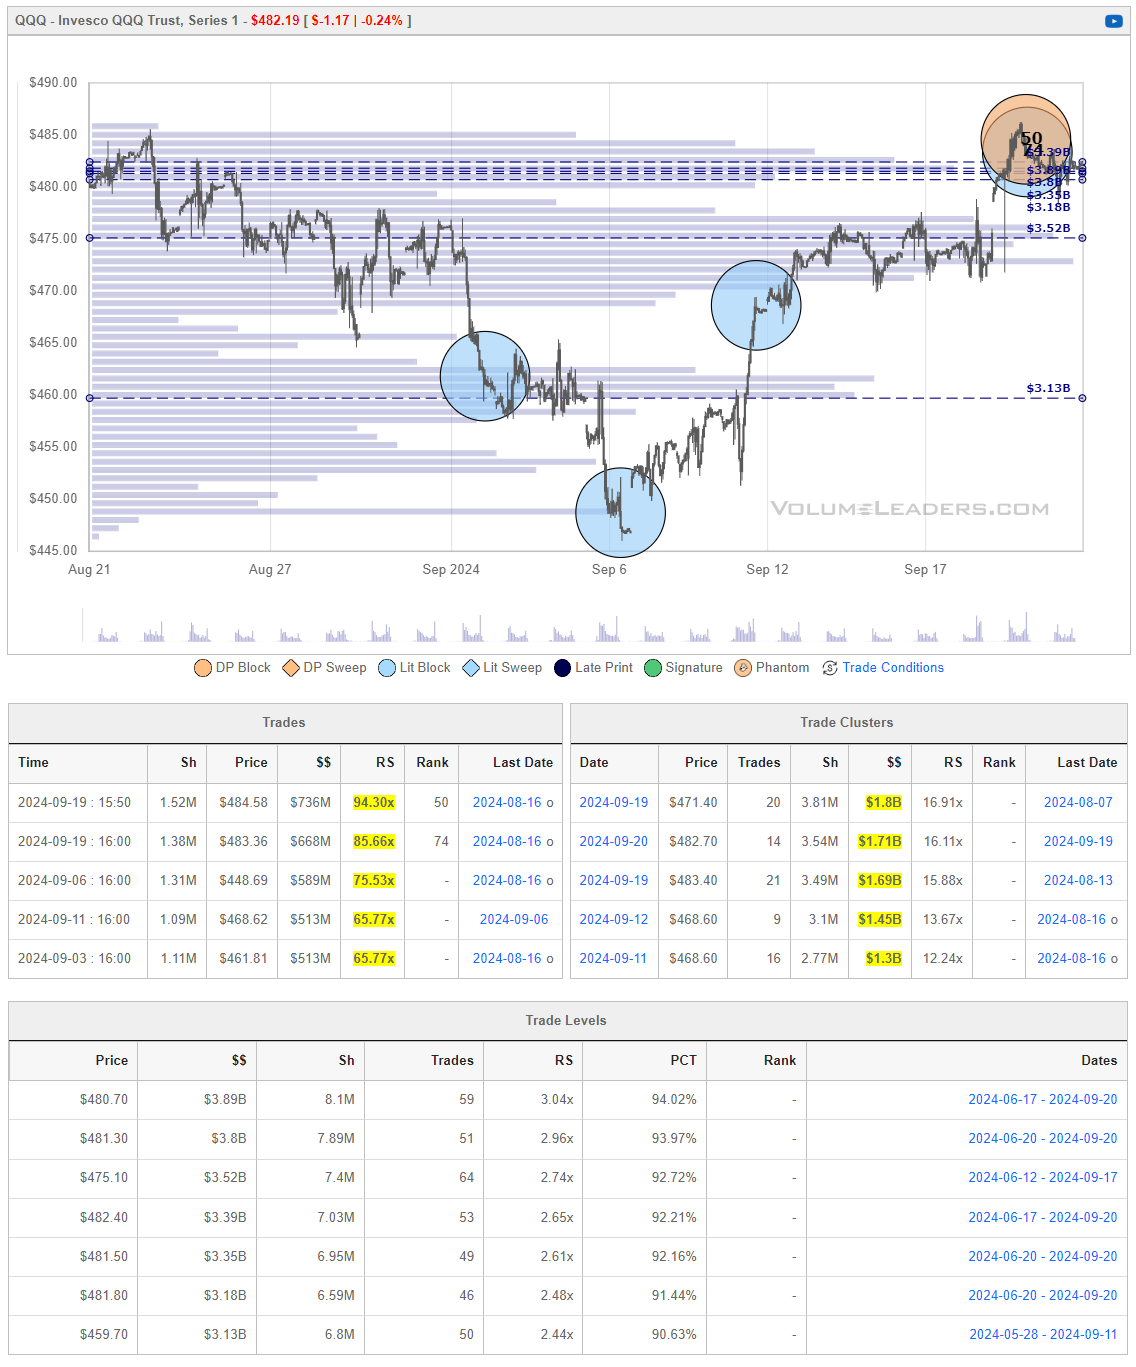
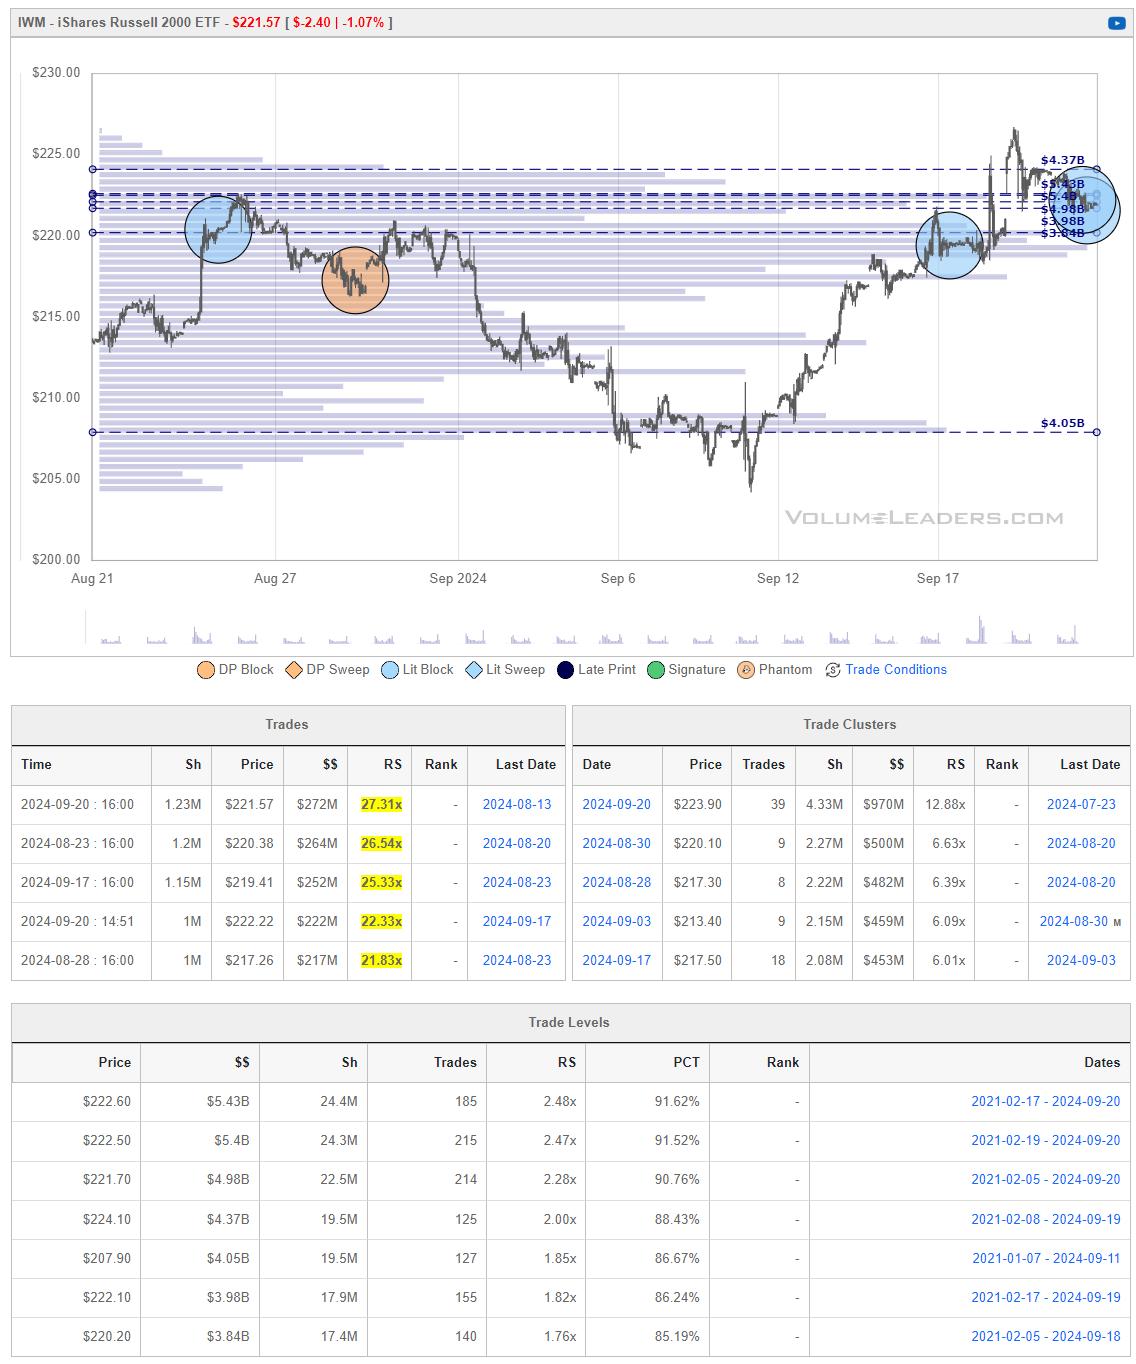
Institutional S/R Levels for Major Indices
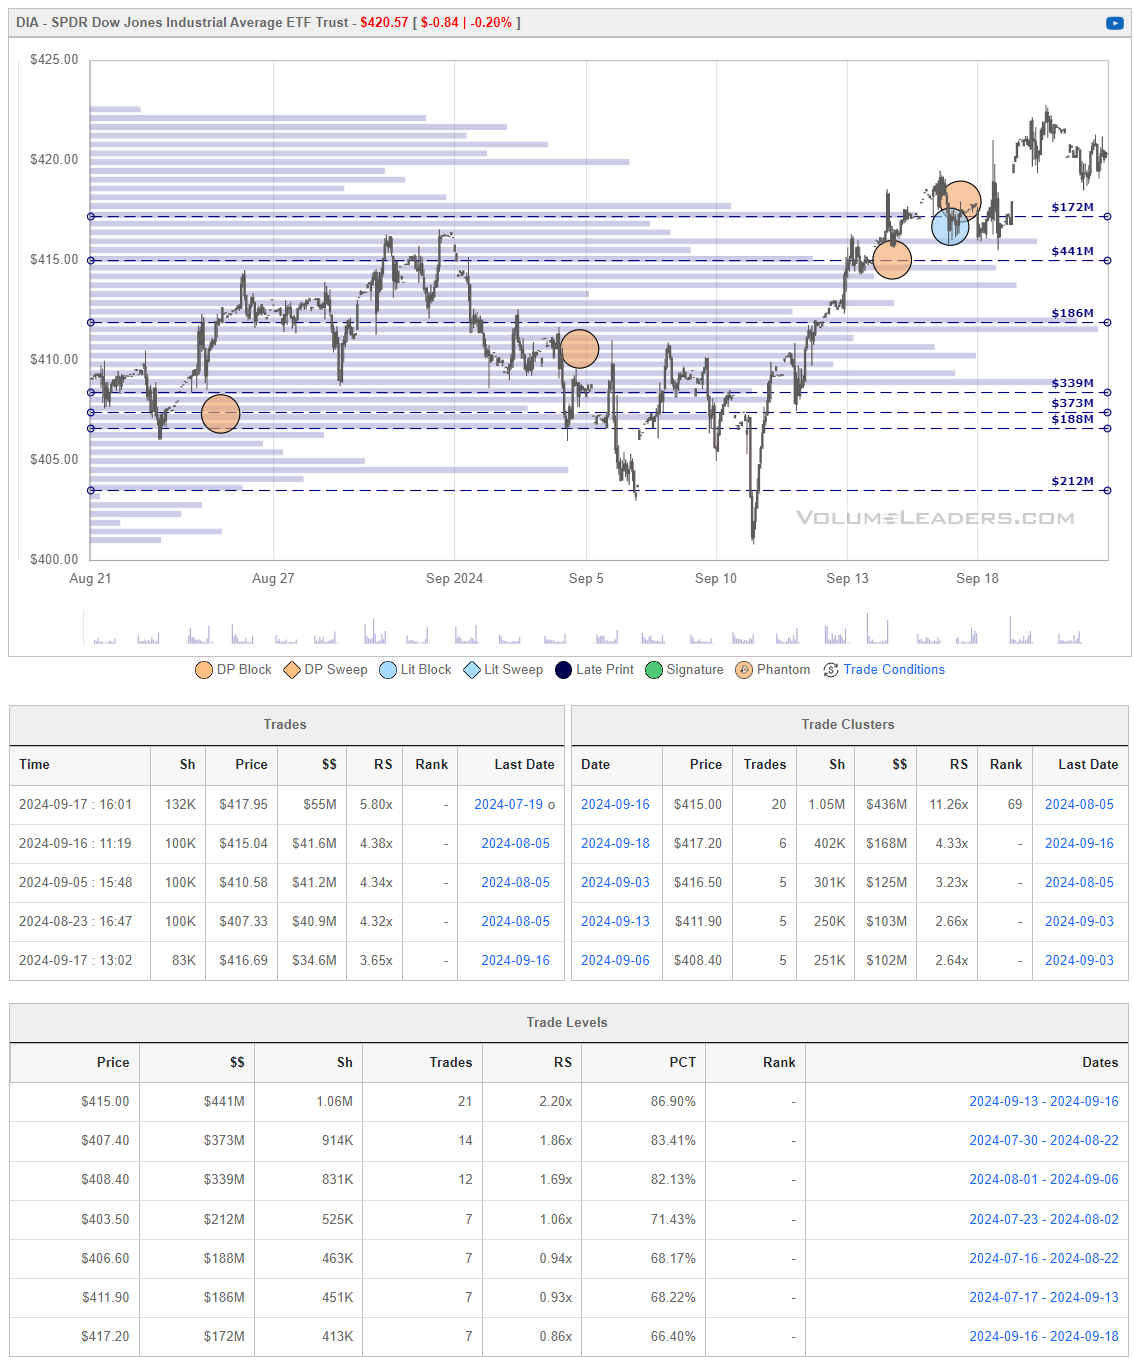
When you’re a large institutional player, your primary goal is to find liquidity - places to do a ton of business with the least amount of slippage possible. VolumeLeaders.com automatically identifies and visually plots the exact spots where institutions are doing business and where they are likely to return for more. It’s one of the primary reasons “support” and “resistance” concepts work and truly one of the reasons “price has memory”.
Levels from the VolumeLeaders.com platform can help you formulate trades theses about:
Where to add or take profit
Where to de-risk or hedge
What strikes to target for options
Where to expect support or resistance
And this is just a small sample; there are countless ways to leverage this information into trades that express your views on the market. The platform covers thousands of tickers on multiple timeframes to accommodate all types of traders. Observe for yourself how accurate the levels are by marking-up your charts with the information in the “Trade Levels” boxes I’m giving for free below and play-along in real-time this week. These charts cover recent sessions but subs will get new levels as they develop, see the latest trades and institutional positioning, have access to levels from other time frames and so much more. When you watch these levels this week, I’m confident you’ll see how clear-cut, intuitive and actionable this information is for yourself.
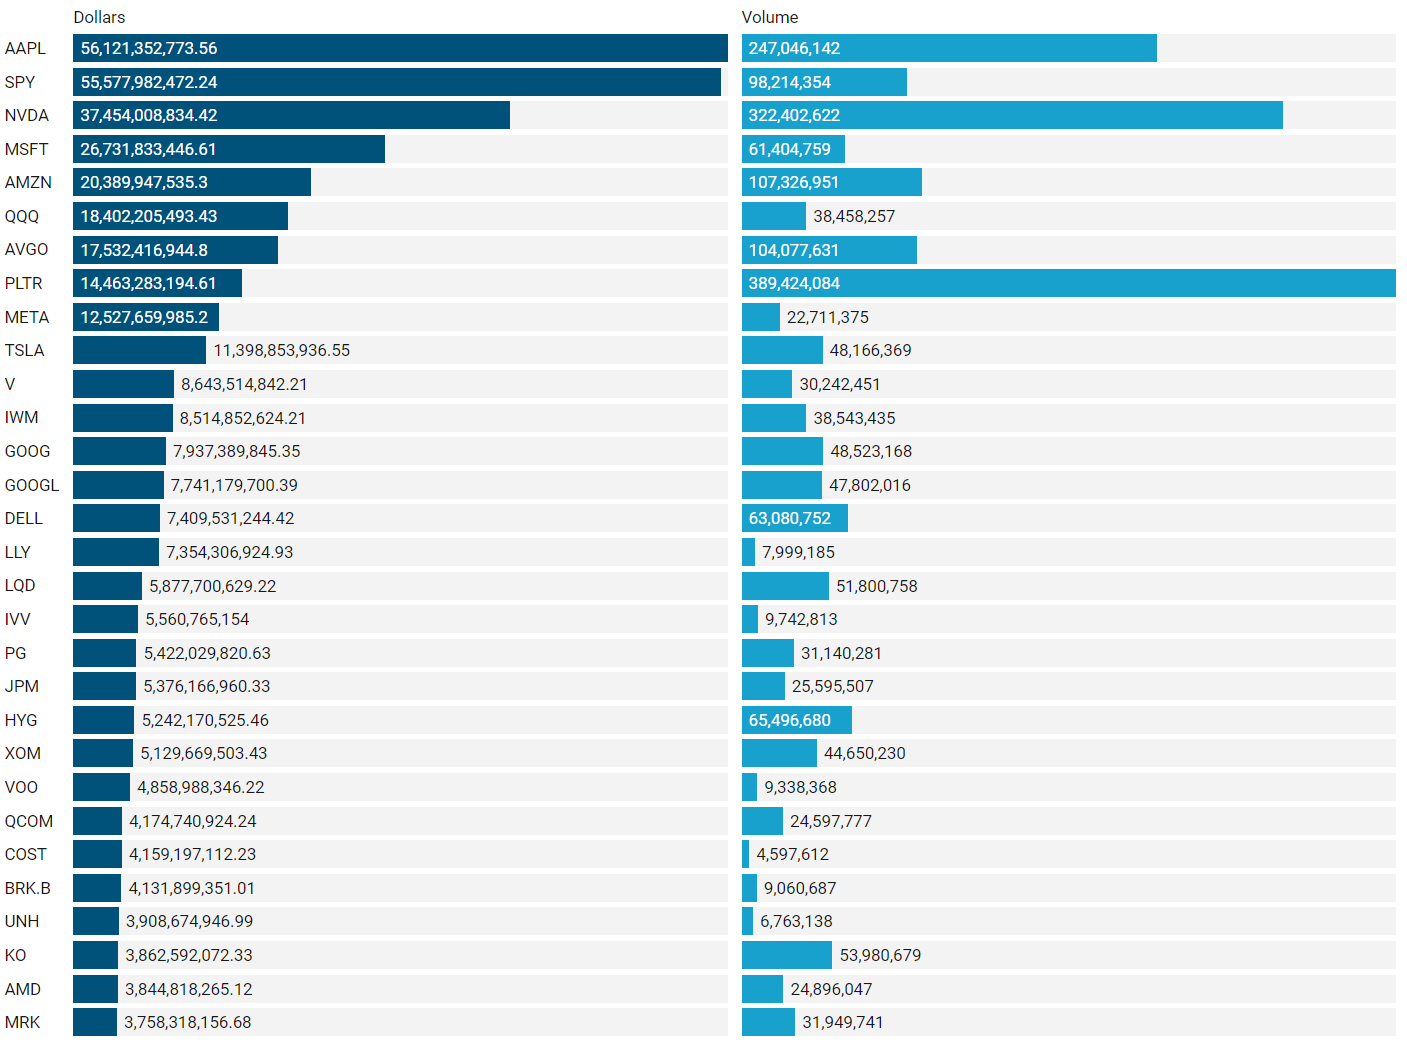
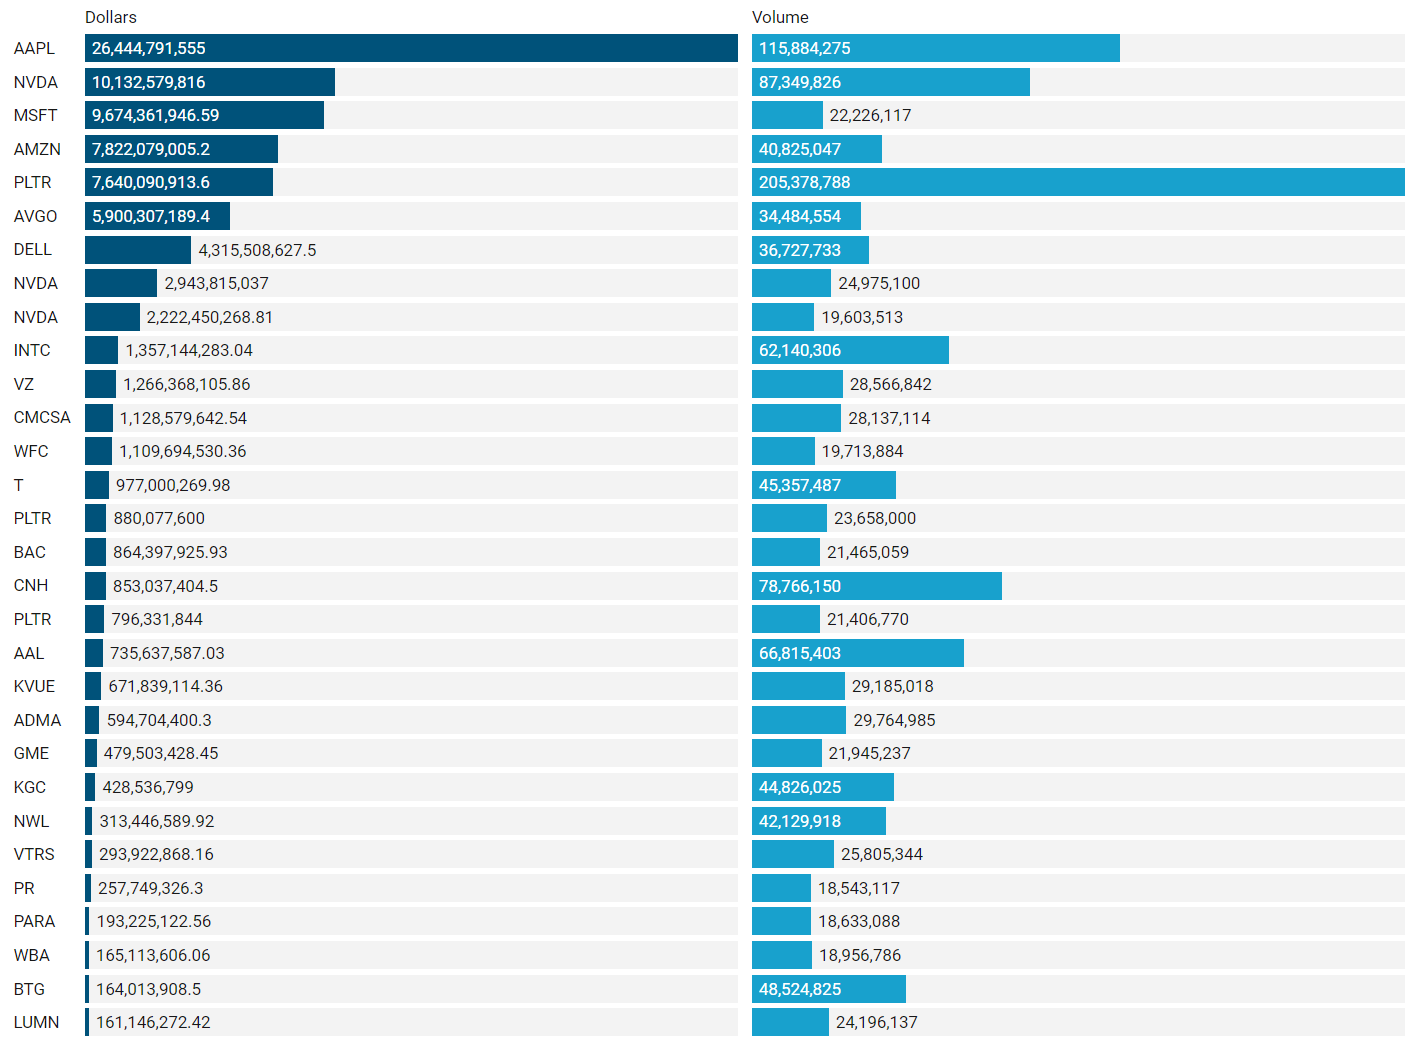
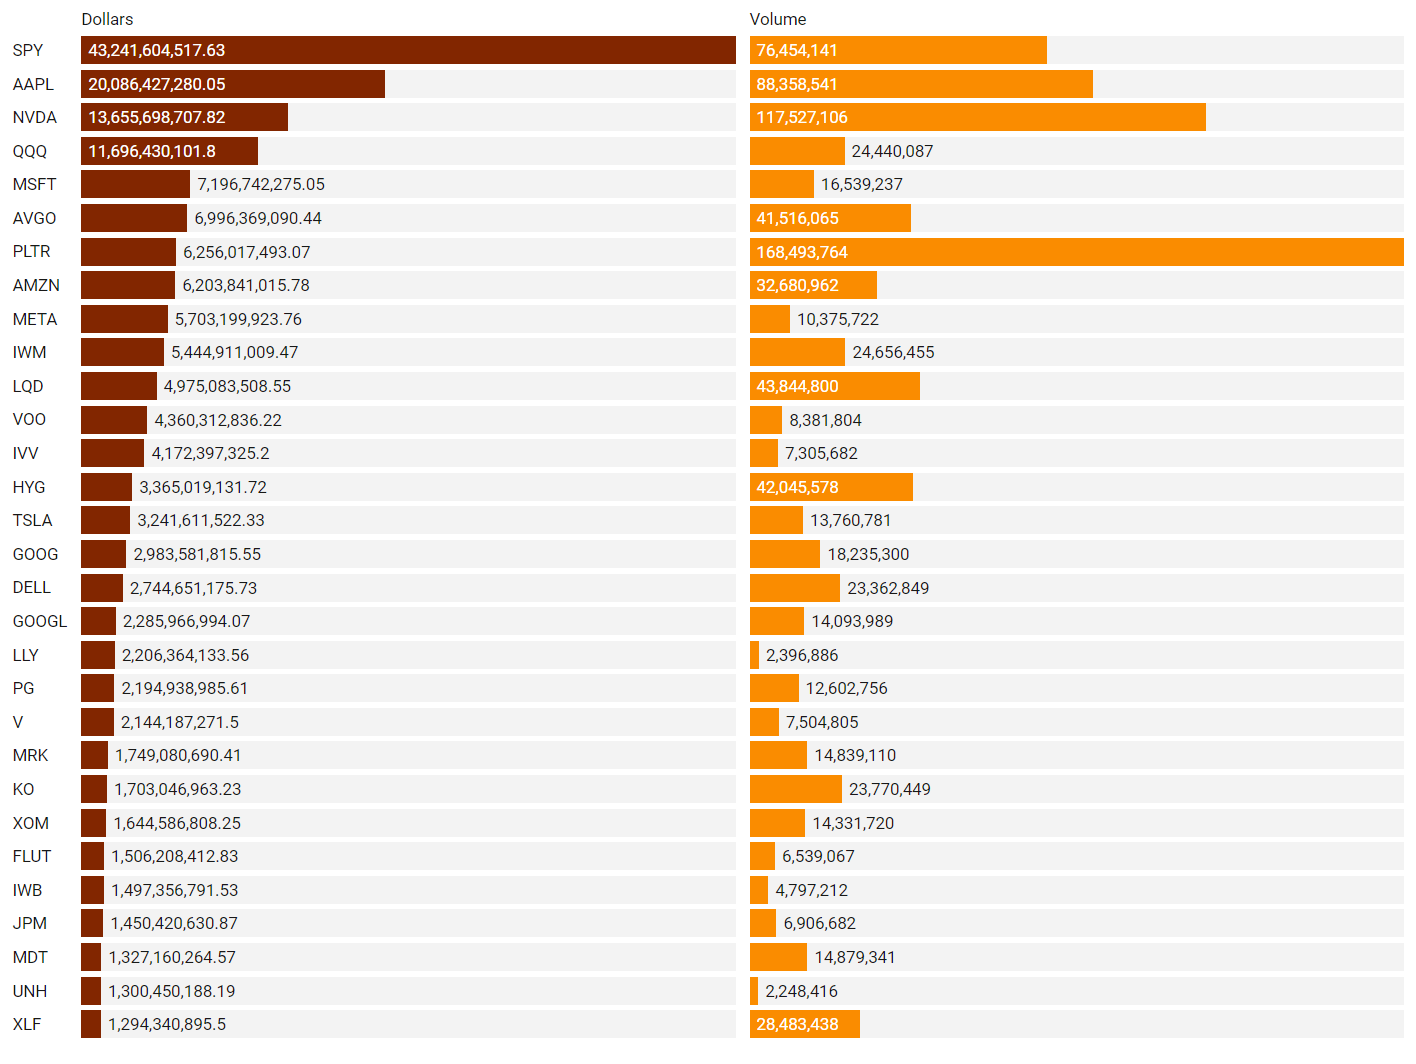
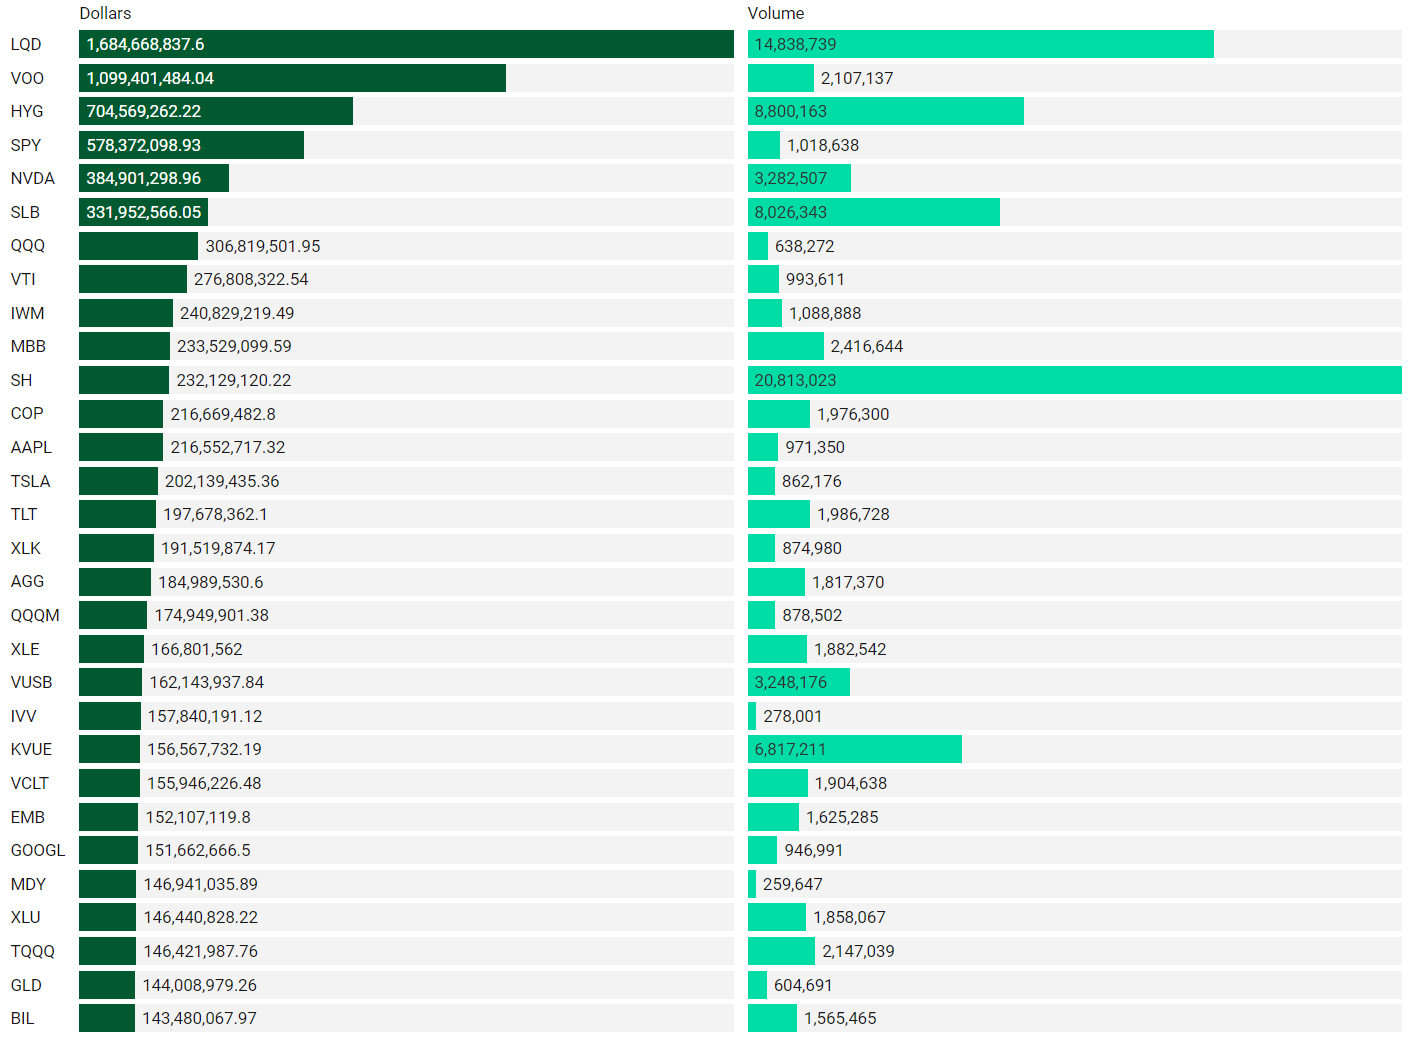
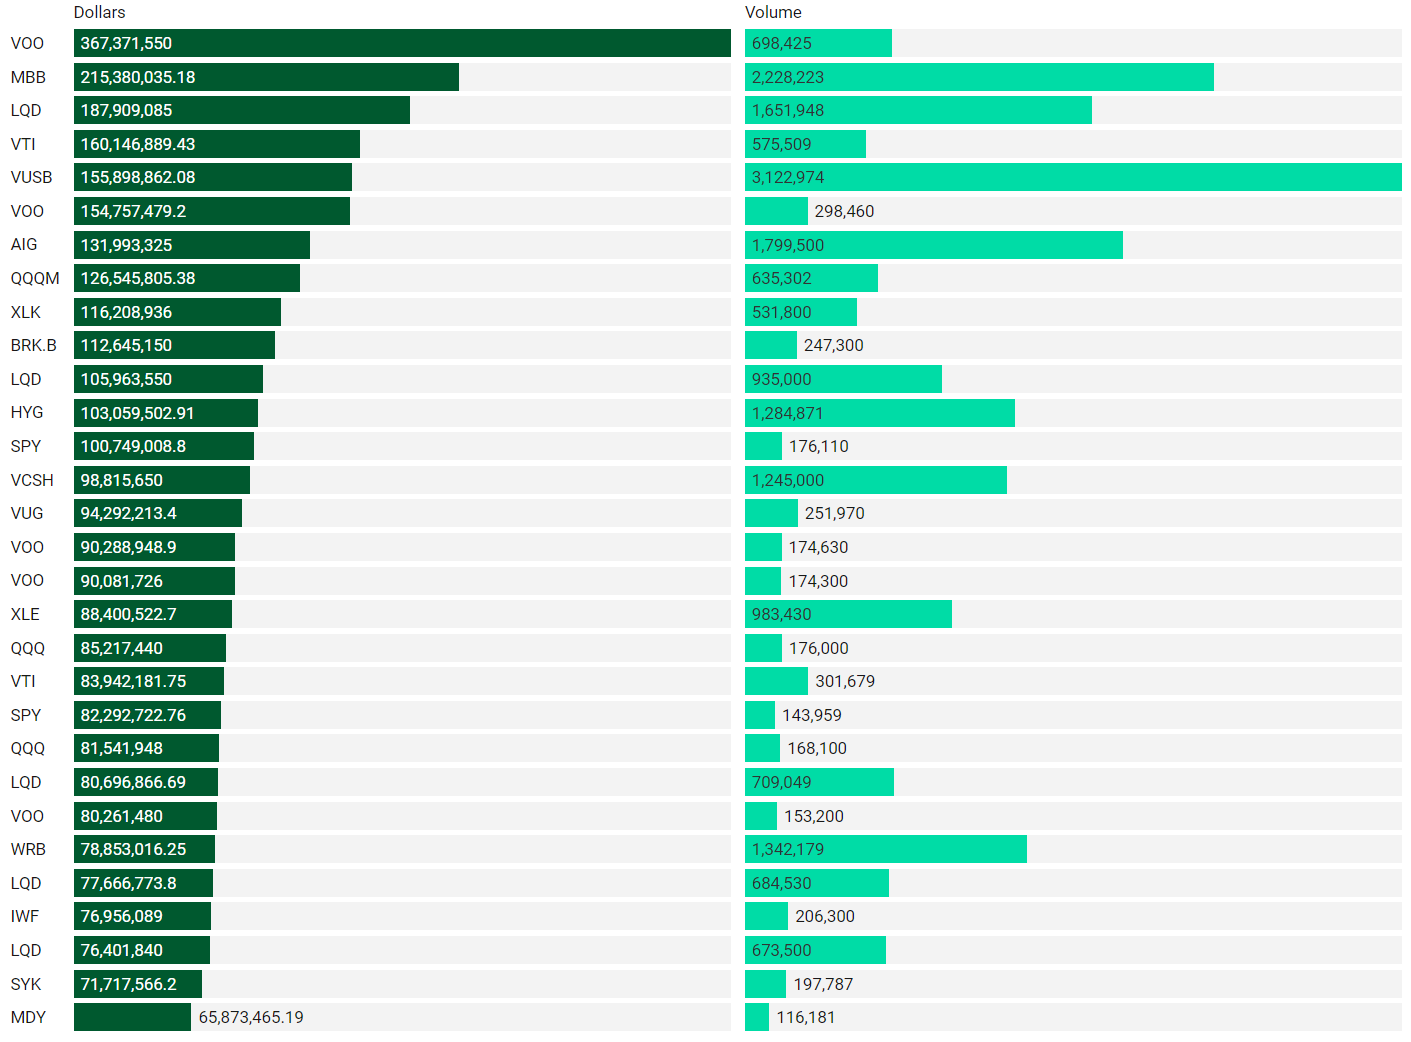
Top Institutional Order Flow
Many excellent trade ideas and sources of inspiration can be found in these prints. While only the top 30 from each group are displayed, the complete results are accessible in VolumeLeaders.com for your convenience to explore at any time. Remember to configure trade alerts within the platform to ensure you never overlook institutional order flows that capture your interest or are significant to you. The blue charts encompass all types of trades, including blocks on lit exchanges; the red/orange charts exclusively depict dark pool trades; and the green charts represent sweeps only.
Top Aggregate Dollars Transacted by Ticker
Largest Individual Trades by Dollars Transacted
Top Aggregate Dark Pool Activity by Ticker
Largest Individual Dark Pool Blocks by Dollars
Top Aggregate Sweeps by Ticker
Top Individual Sweeps by Dollars Transacted
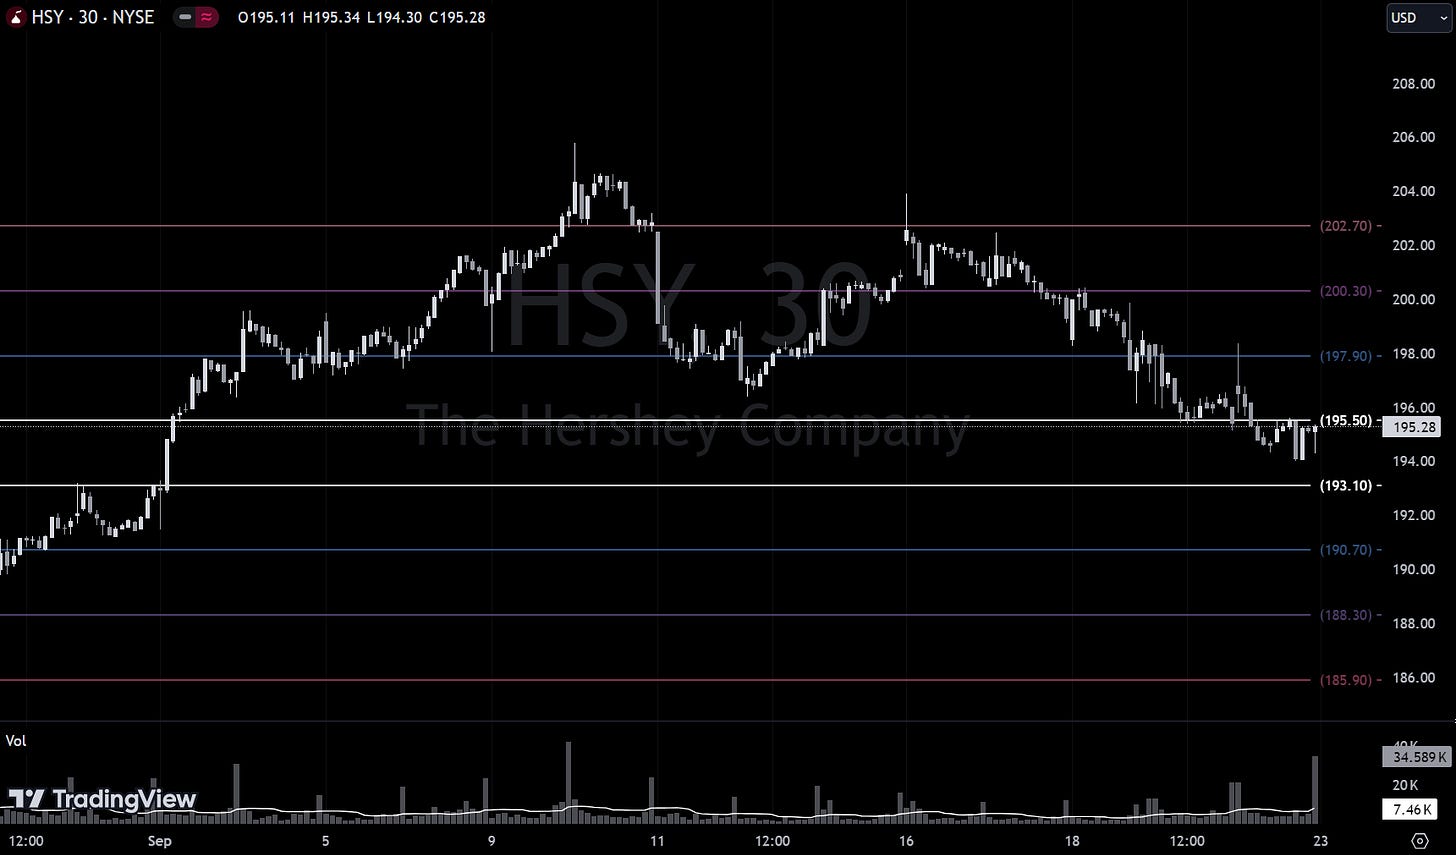
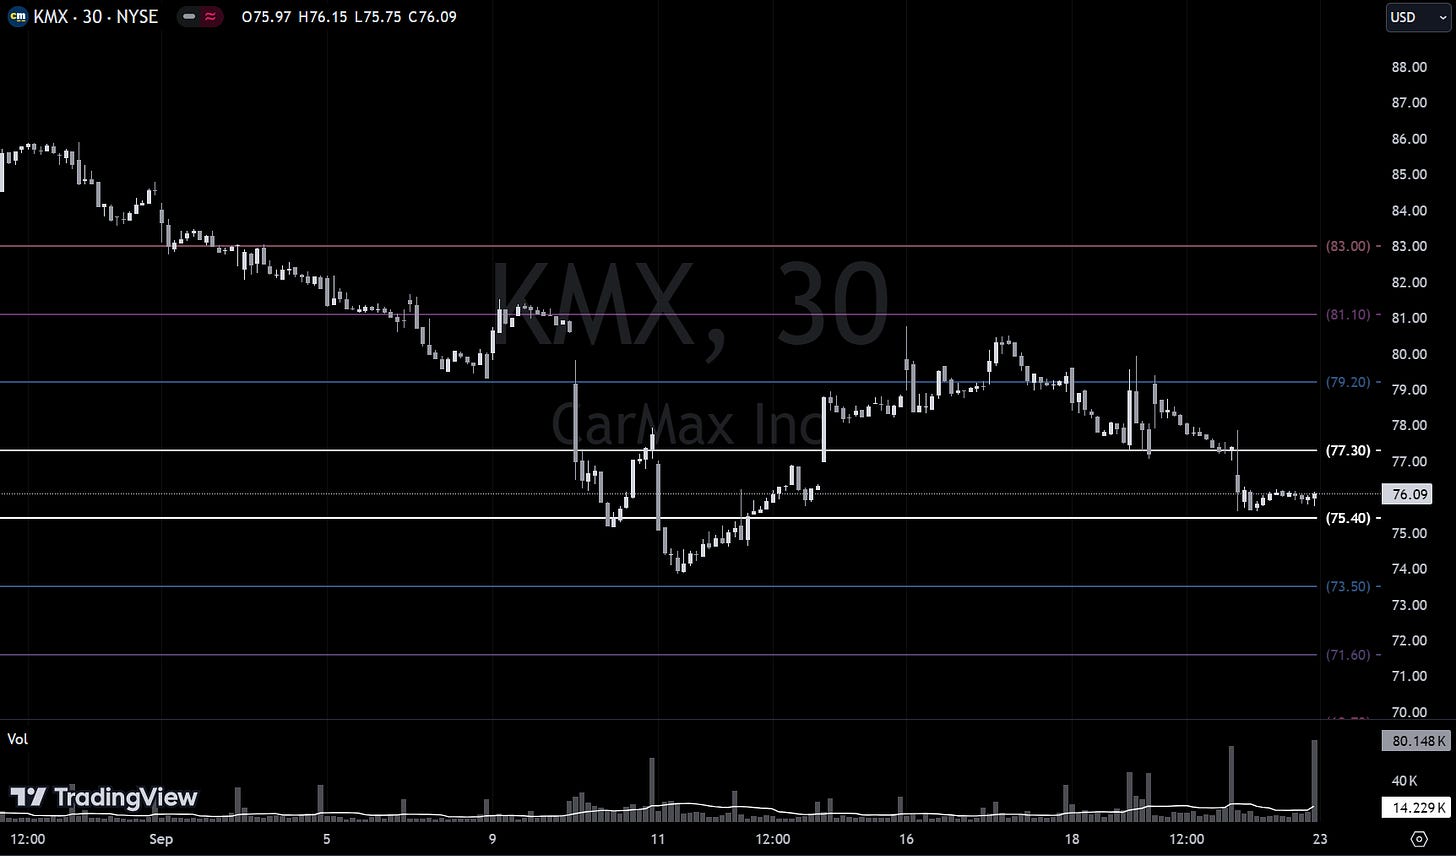
Institutional S/R Levels for Individual Tickers
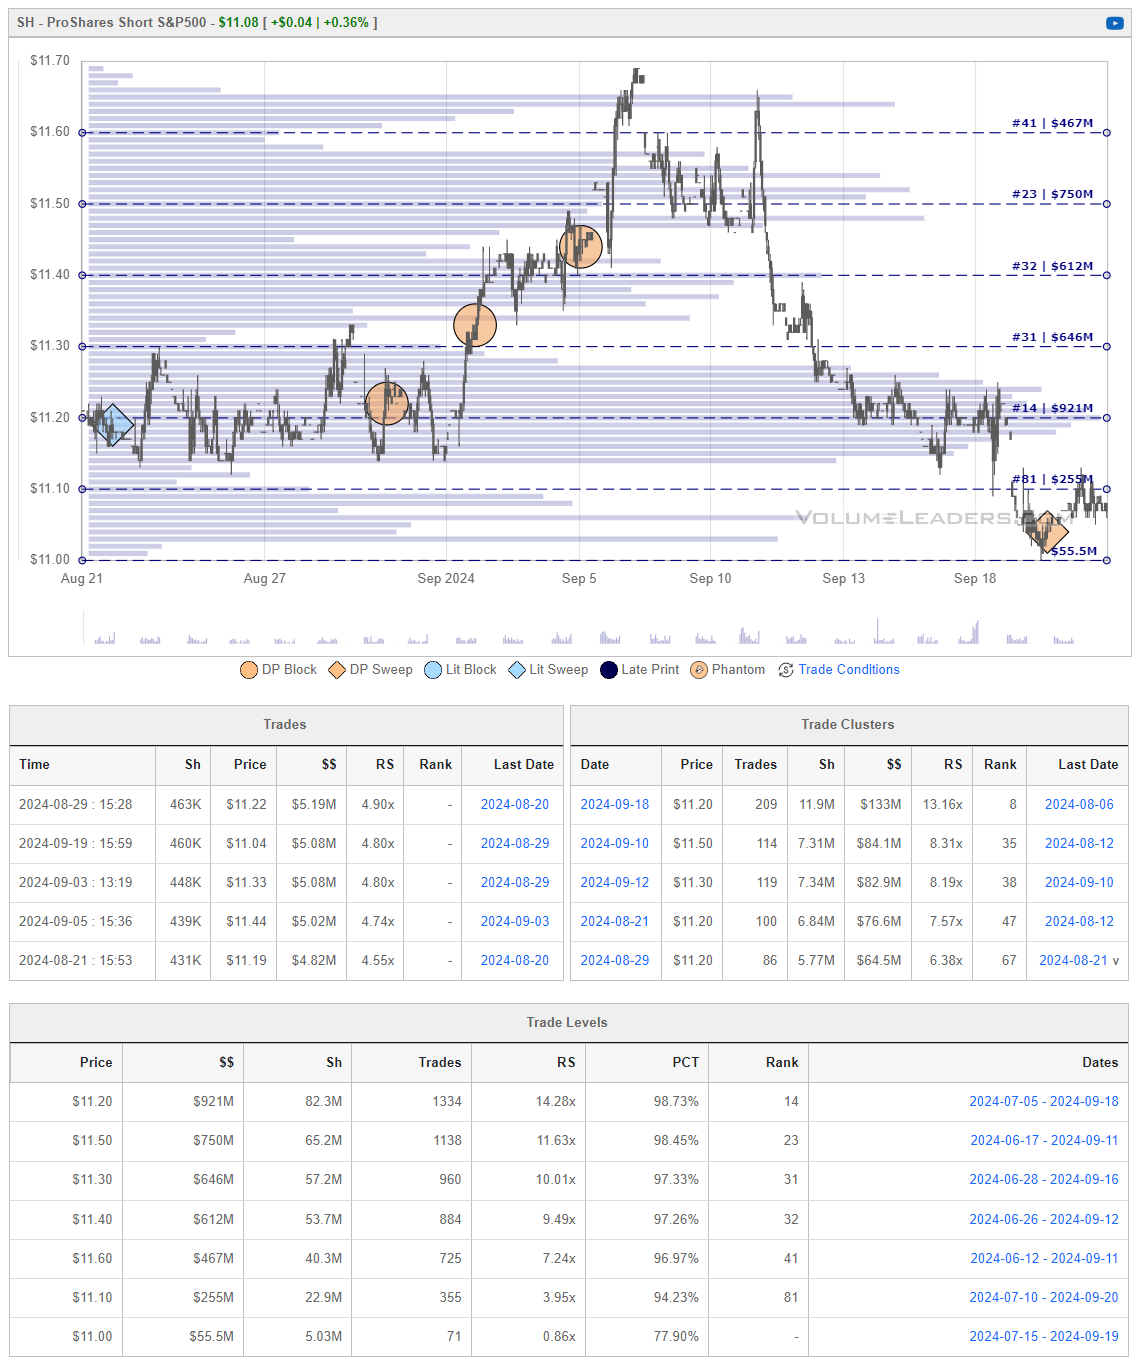
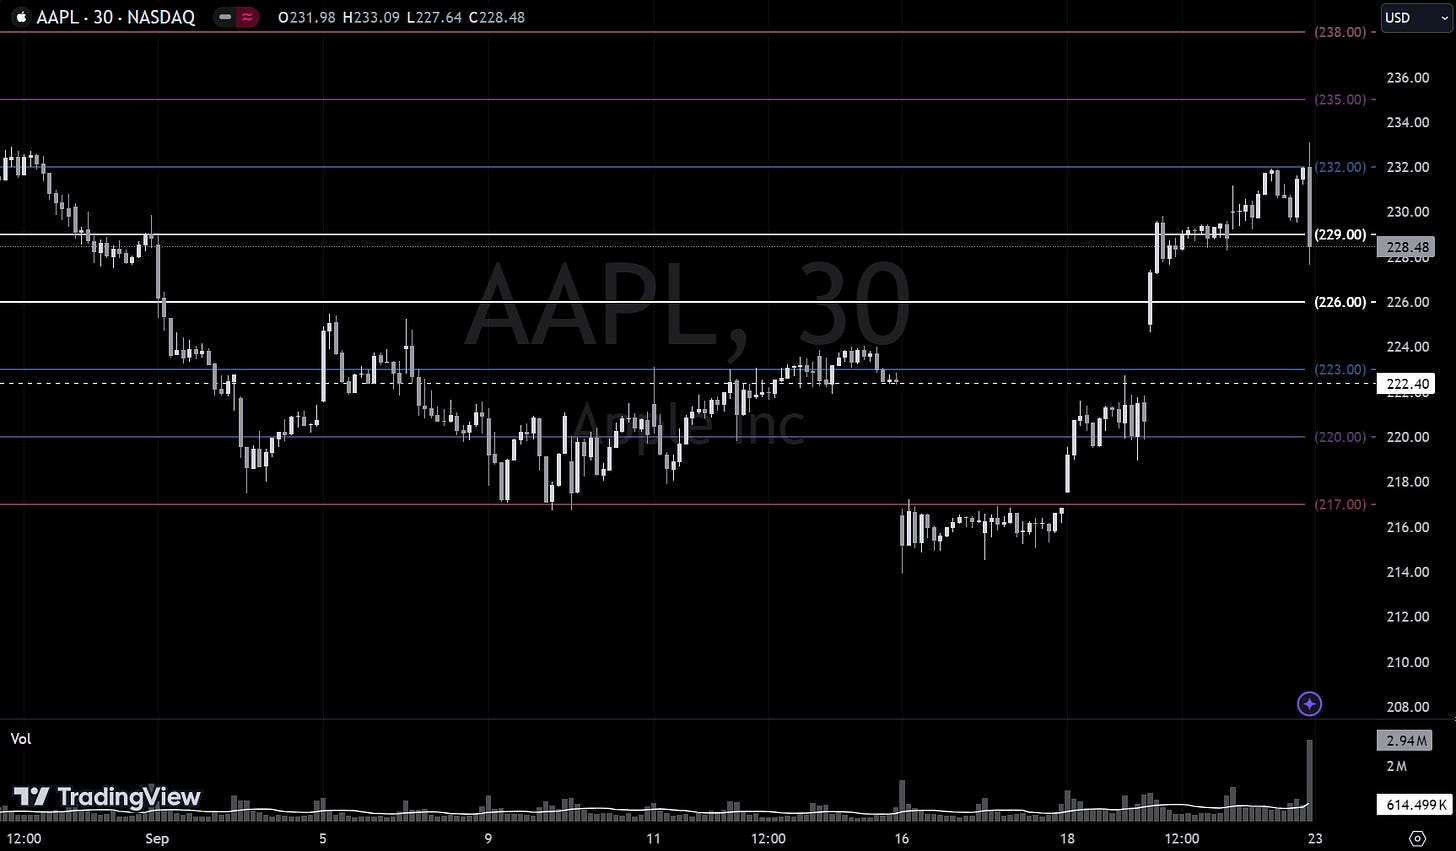
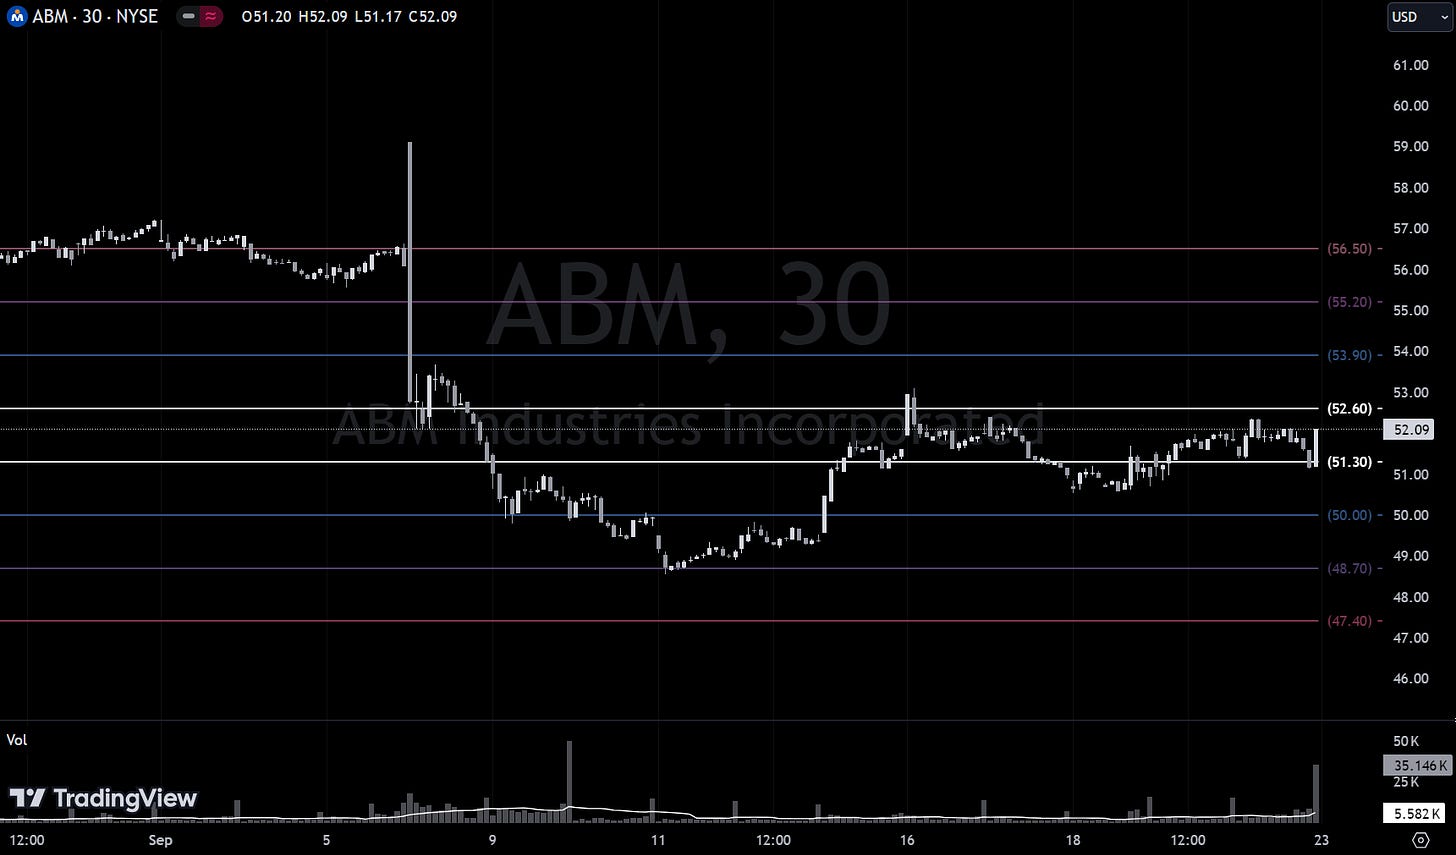
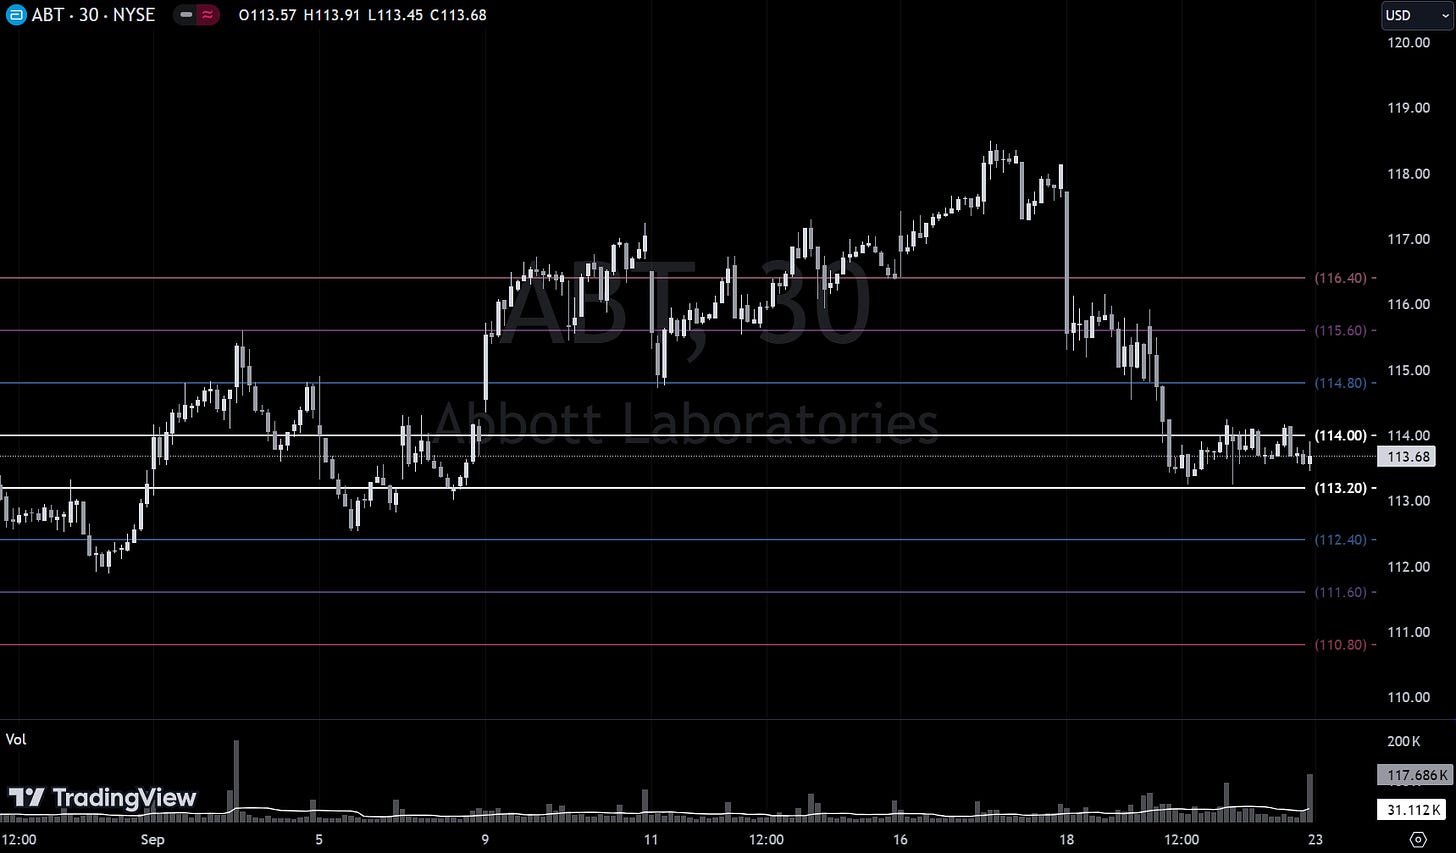
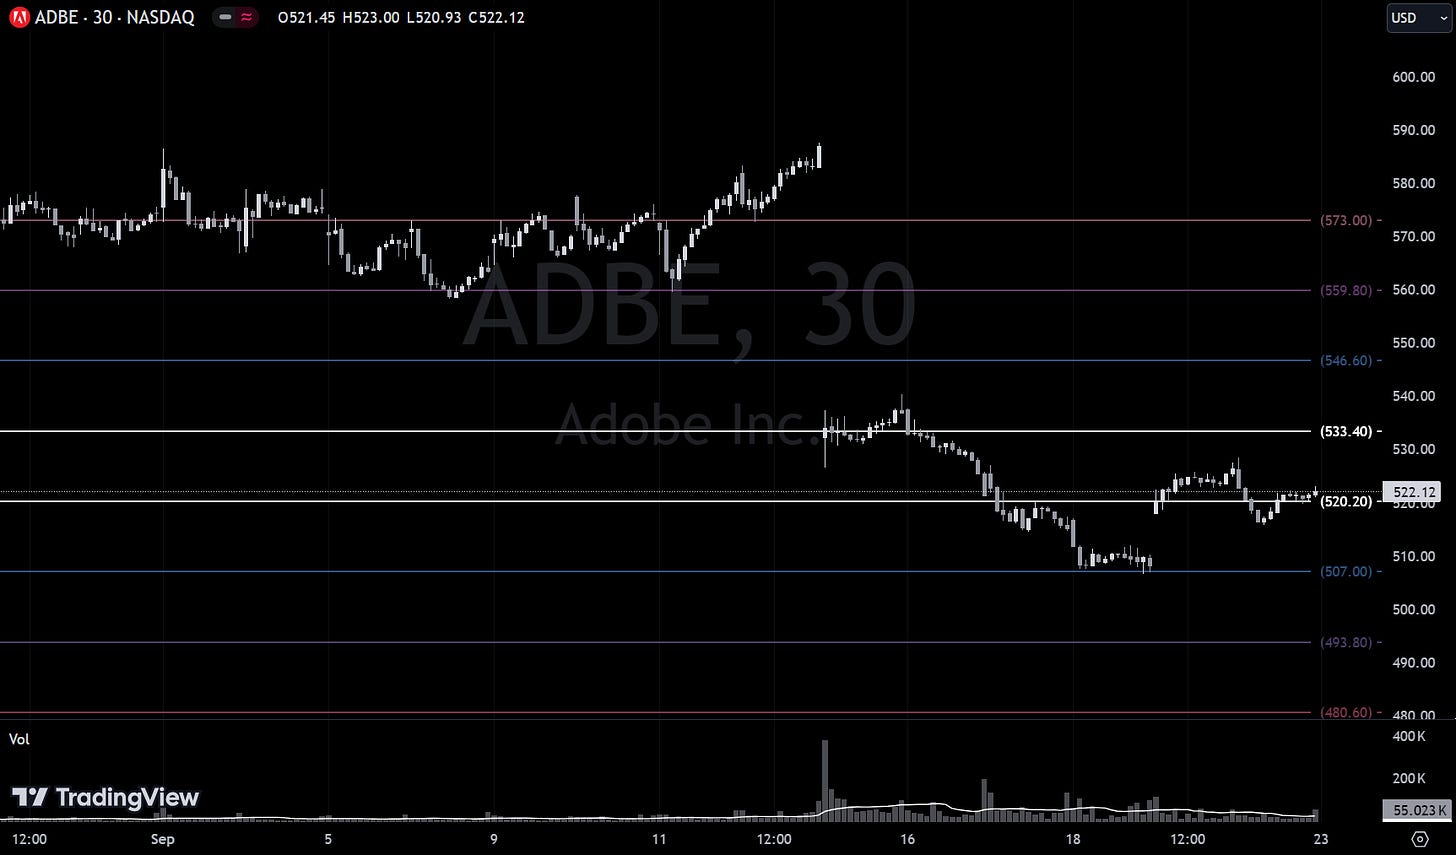
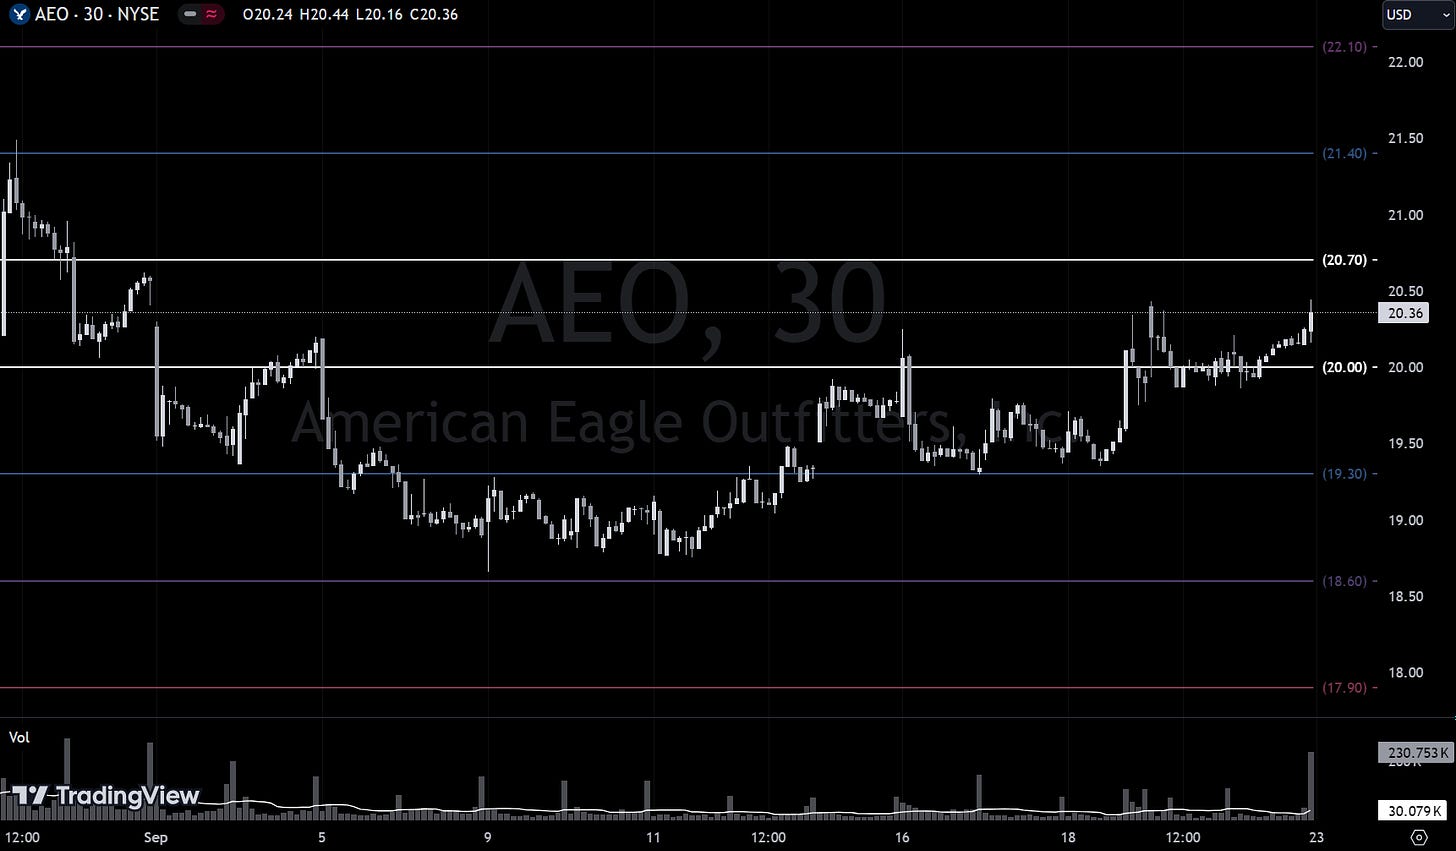
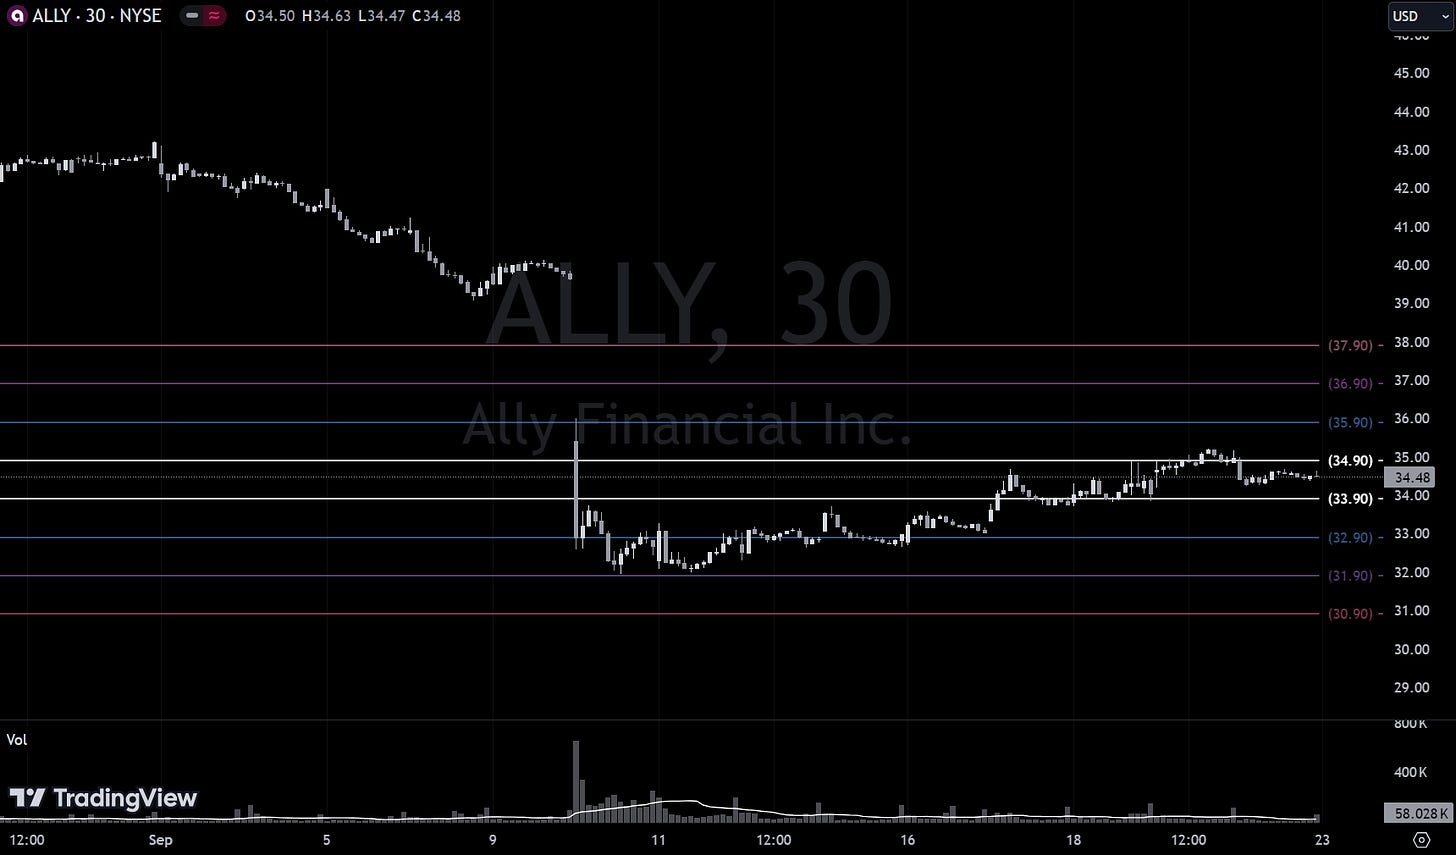
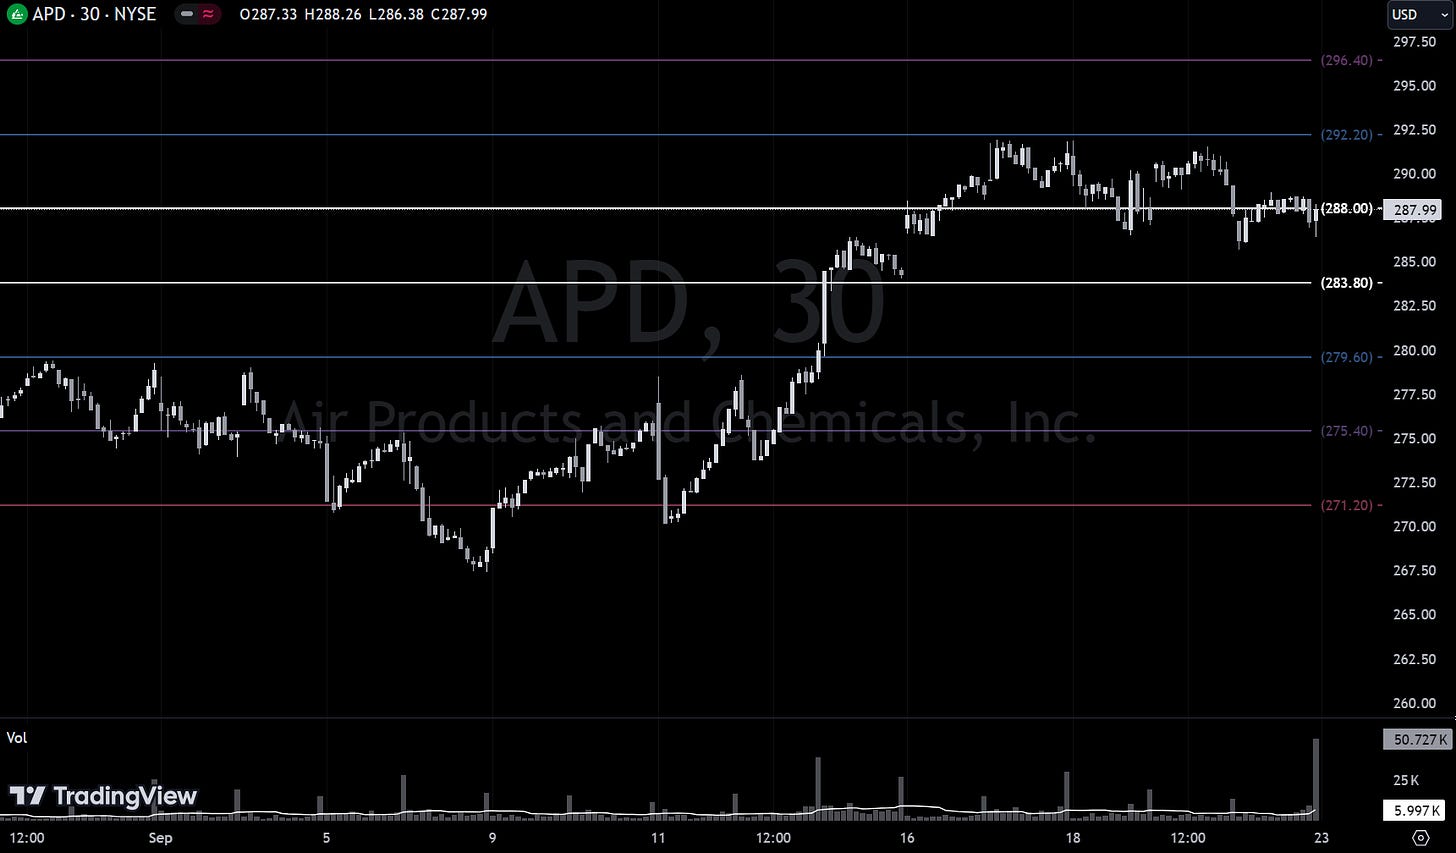
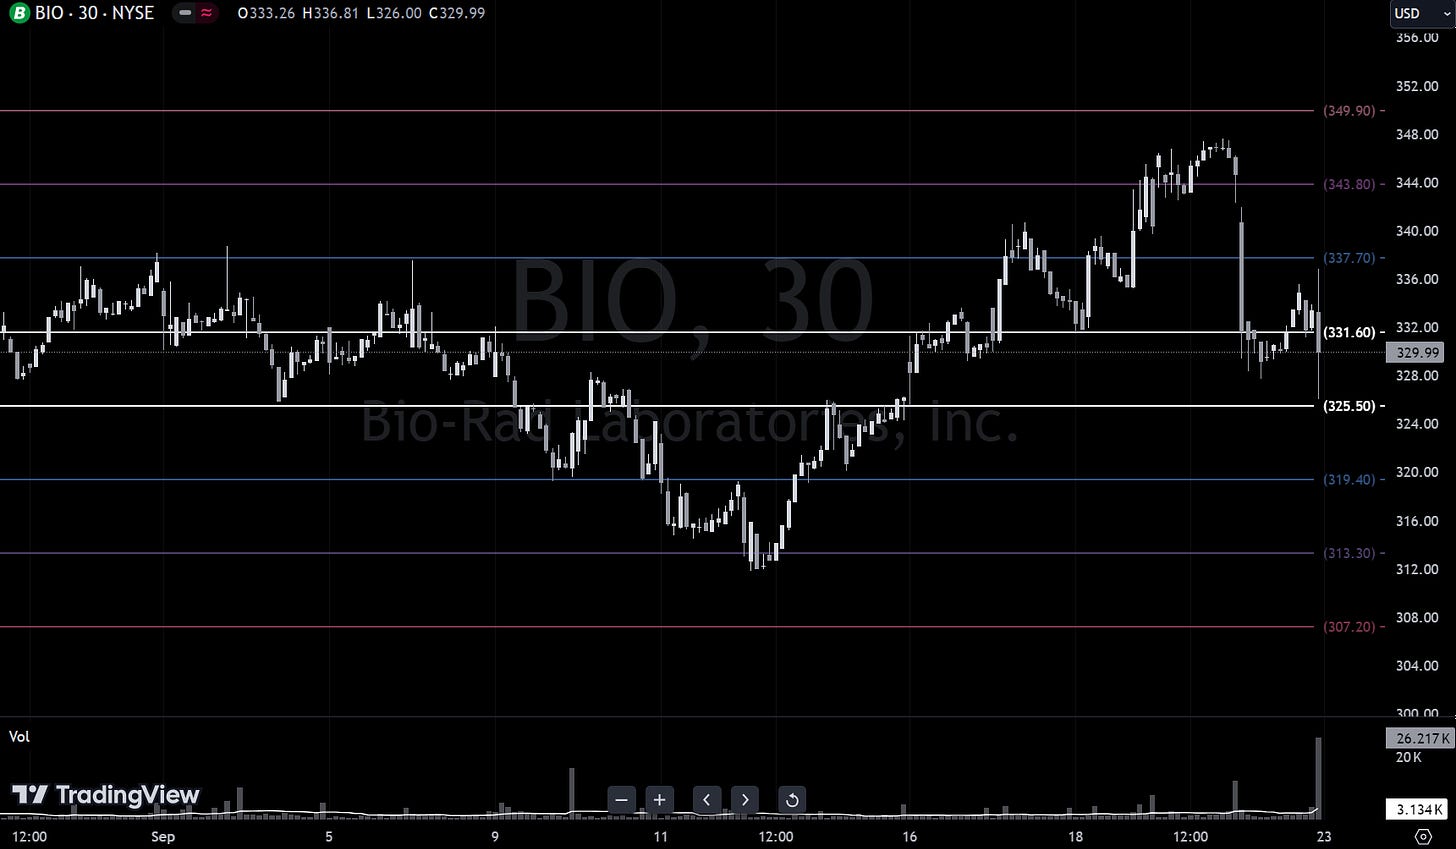
Please read “Institutional S/R Levels For Major Indices” at the top of this stack to understand the nature and importance of what we’re looking at here visually. Institutions leave footprints that VolumeLeaders.com can illustrate for you while providing context to assess things like institutional conviction and urgency.
SH is the ProShares Short S&P500 ETF. This exchange-traded fund is designed to provide investment results that inversely correlate to the daily performance of the S&P 500 Index. Essentially, if the S&P 500 Index declines on a given day, the SH ETF is expected to increase in value by approximately the same percentage, before fees and expenses. Conversely, if the S&P 500 Index rises, the SH ETF will likely decrease in value.
The ProShares Short S&P500 ETF is commonly used by investors seeking to profit from short-term declines in the stock market or to hedge against downward moves in their long equity positions. Because it is designed to achieve its inverse returns on a daily basis, the performance of SH over longer periods can differ significantly from the inverse of the performance of the S&P 500 Index over the same period due to compounding effects.
We got a nice sweep on Opex at the 30-day lows. This may just be some compulsory hedging or speculation. If it is a signal, I would expect price to trade quickly over $11.10 into $11.20; if price can climb over $11.20, it’s time to put your head on a swivel. Set price alerts in your platform of choice as an effective early-warning-system.
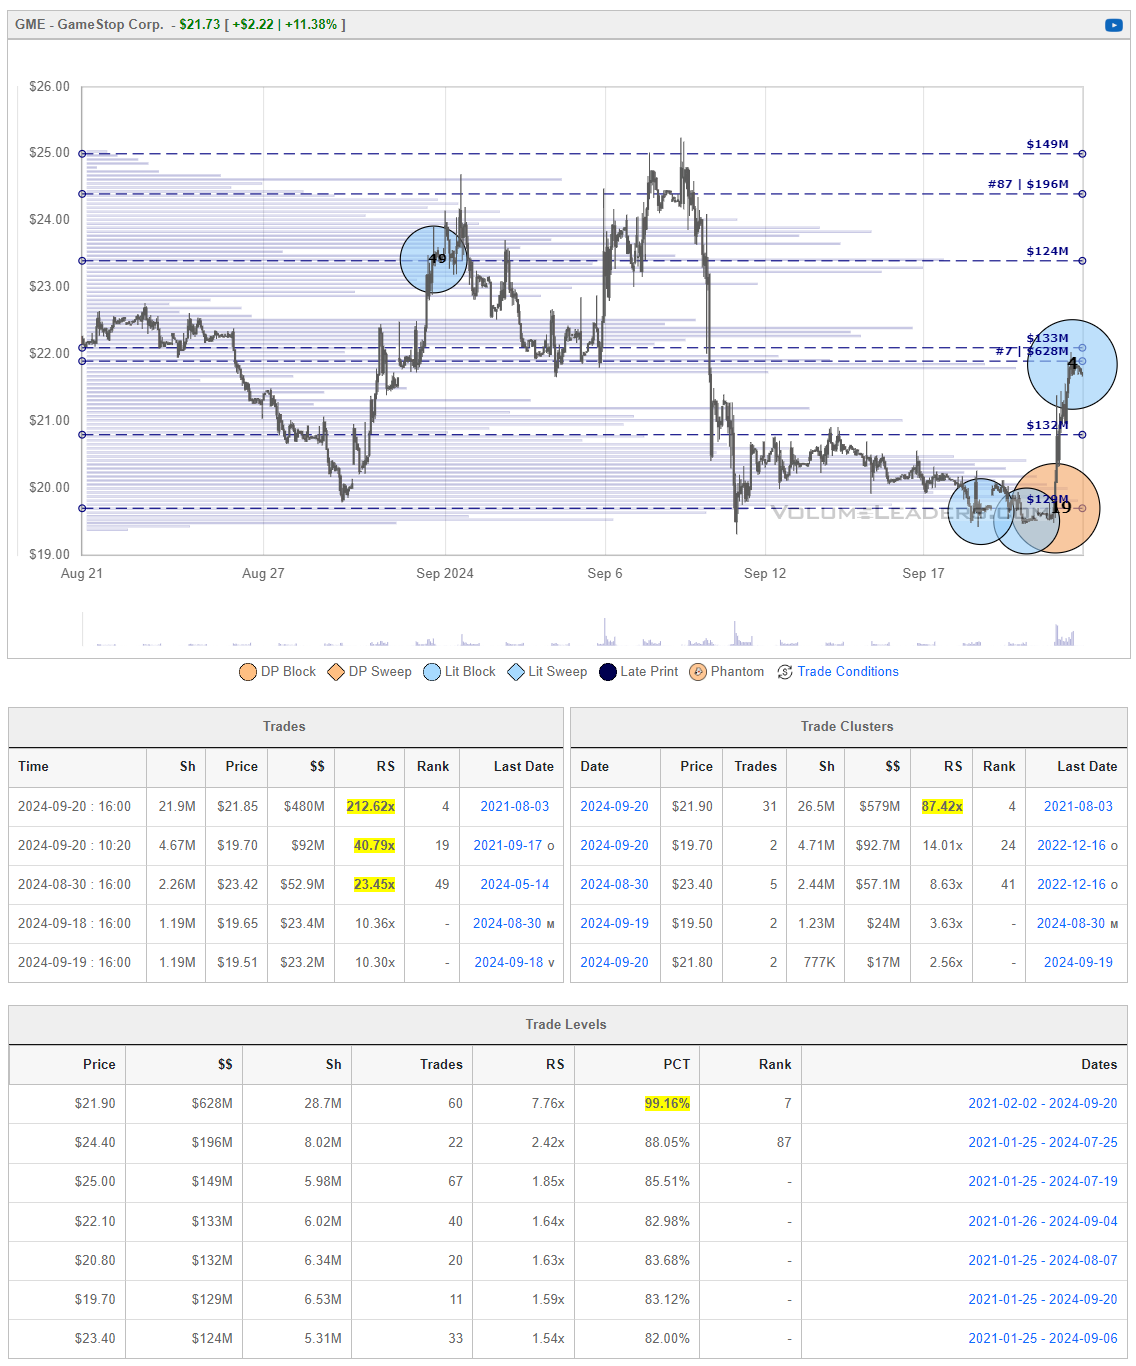
Certainly not the rags-to-riches darling it used to be but clearly still subject to a good pump. We got some Opex tomfoolery that may have played out. The levels are very responsive here so if you’re actively trading this name, mark these on your chart as pass/fail or target levels.
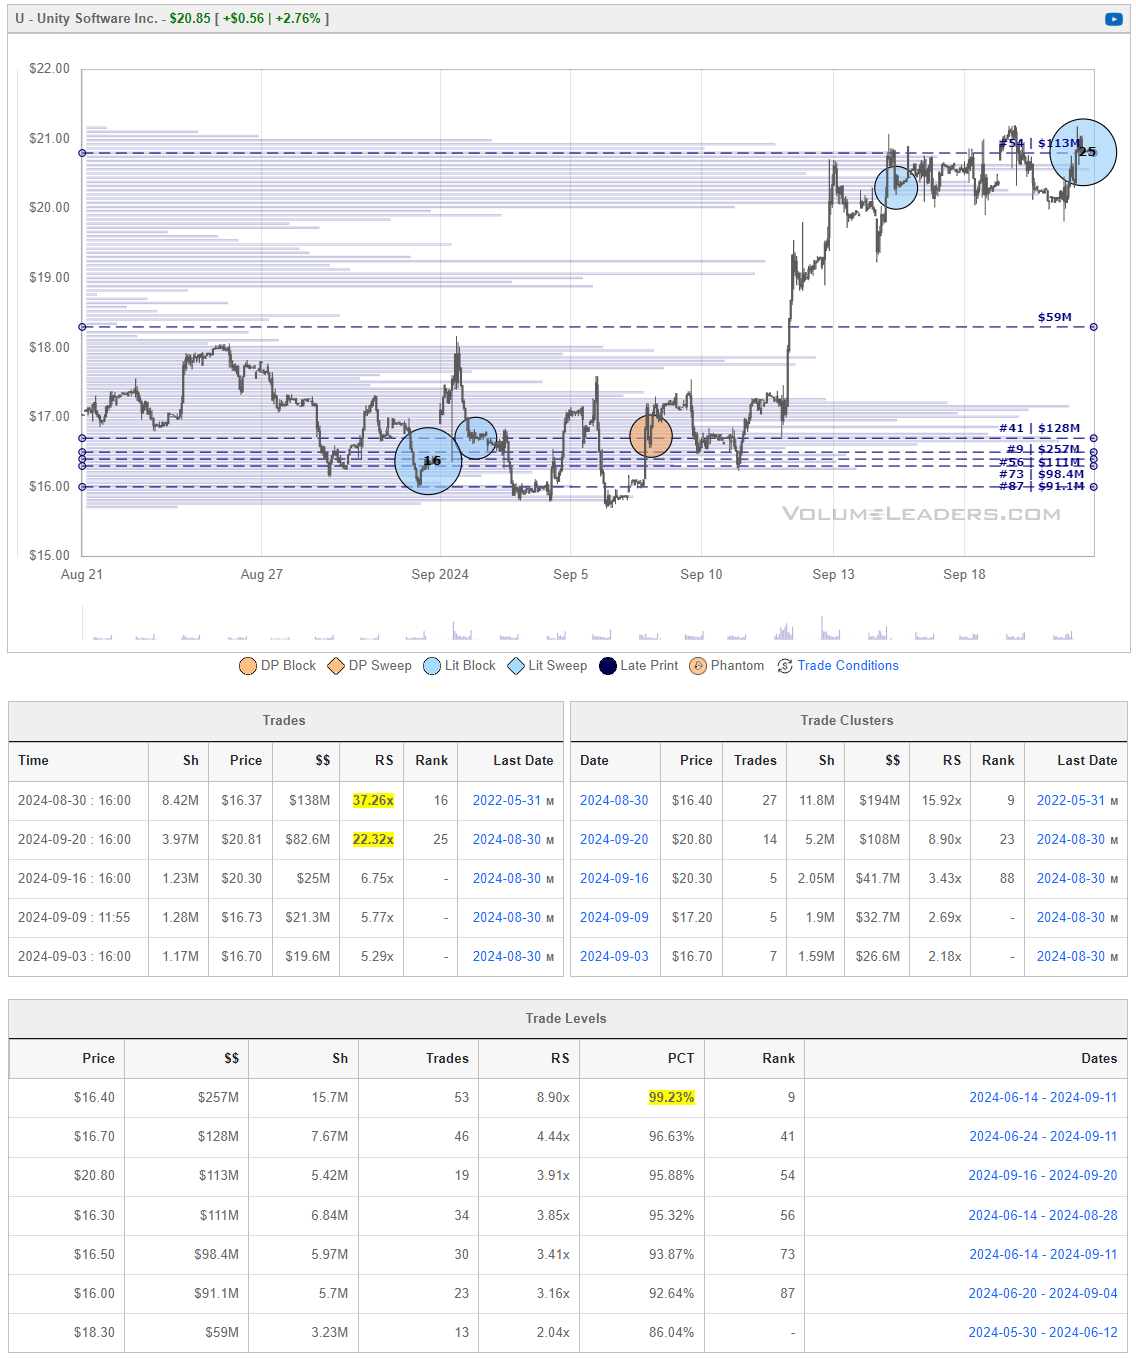
Price is responding well to recent news about changes to its pricing structure and recent analyst upgrades.
You can clearly see the institutional accumulation at the lows before price traded back into 30-day highs and prior institutional level of interest. Structurally, I wouldn’t be surprised to see a backtest into $18-$19 before another attempt higher.
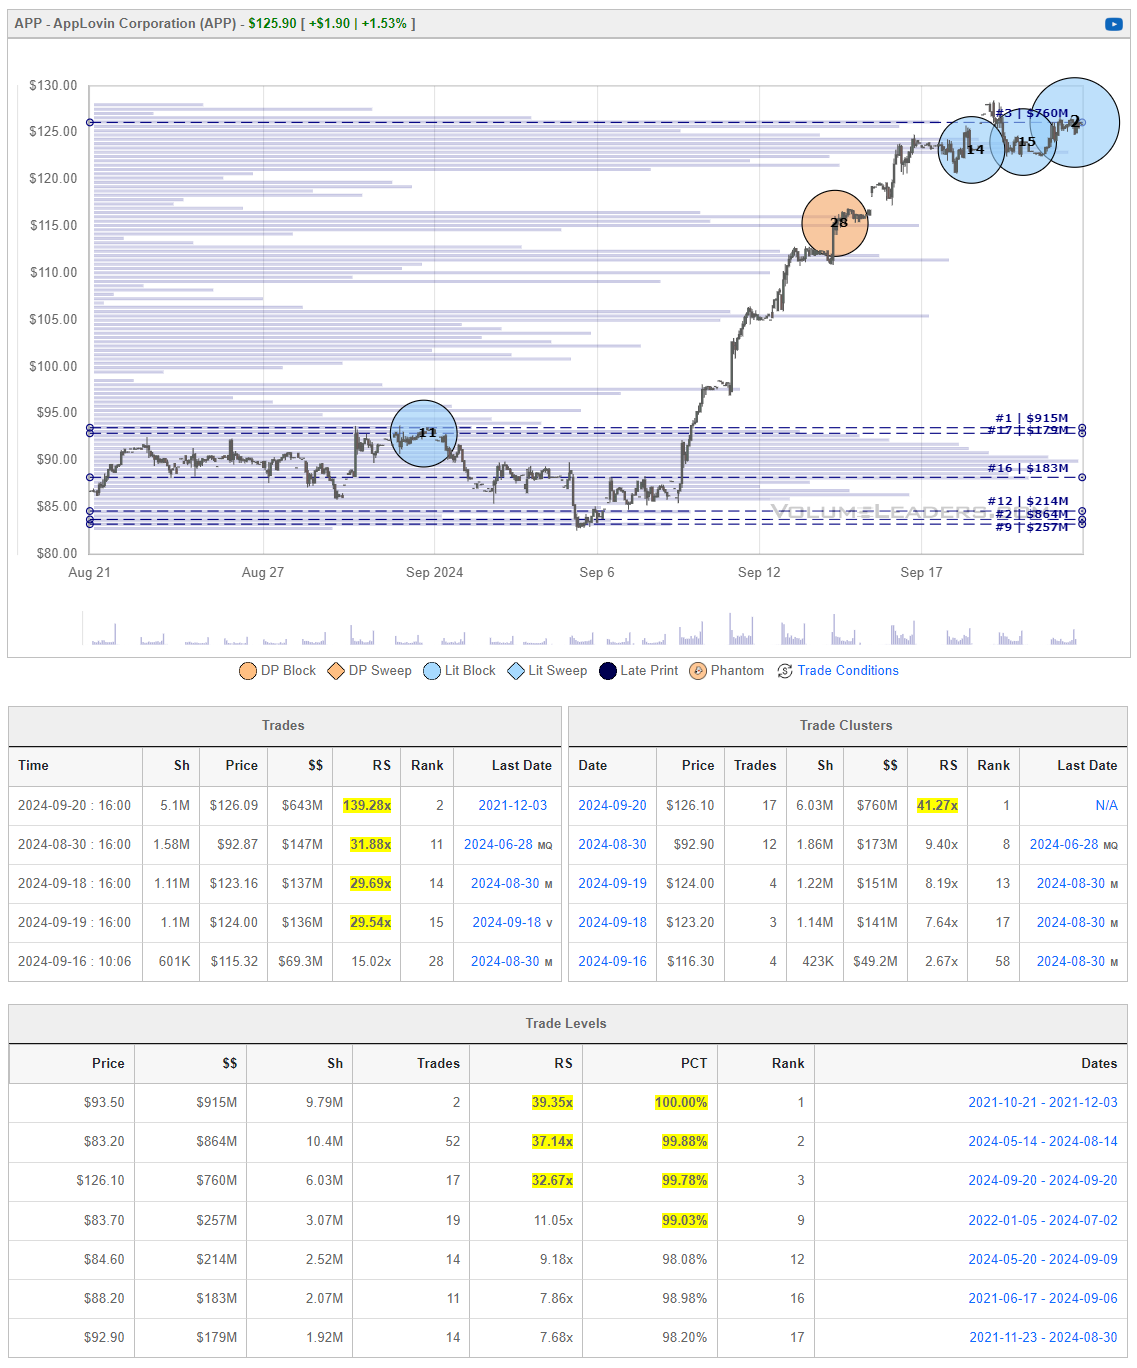
AppLovin Corporation (APP) primarily operates in the mobile app ecosystem, offering a platform that provides developers with a suite of tools to grow their apps through user acquisition and monetization. AppLovin’s platform includes analytics, marketing, monetization, and publishing capabilities. They also own a portfolio of popular mobile games.
Unity Software Inc. (U) is widely known for its real-time 3D (RT3D) content creation tools, particularly its Unity Engine, which is extensively used in the development of video games, as well as in other industries such as film, automotive, architecture, and more. Unity also provides solutions for VR and AR experiences and has been expanding its offerings to include more tools for developers across various platforms.
While both companies provide tools and services that support game and app developers, Unity’s focus is more broadly on real-time 3D content creation across various industries, whereas AppLovin focuses more on the mobile app ecosystem, particularly in marketing, monetization, and mobile game development. They do compete in the sense that both are vying for the attention of digital content creators, particularly game developers, but their offerings are distinct enough that they also operate in different niches within the broader tech landscape.
We provided this name as a Precision Swing a couple of weeks ago and indicated that price over $84.60 would bring a respectable move. This exceeded all expectations but is an excellent demonstration of how positioning almost always precedes the news which then provides the rationale for the move:
There is no doubt that retail got squeezed multiple times trying to pick the top on this explosive move. I can honestly say VL users were extremely cool-headed based on the conversations in our Discord trading rooms - those watching were waiting for institutional activity to potentially mark a top and then waited further still for price to fail. We’ve not seen price lose a trade level yet but a flurry of recent activity may give everyone their first taste of blood. There is still a ton of positioning at the lows so we’ll see just how far sellers get.
VL Precision Swings
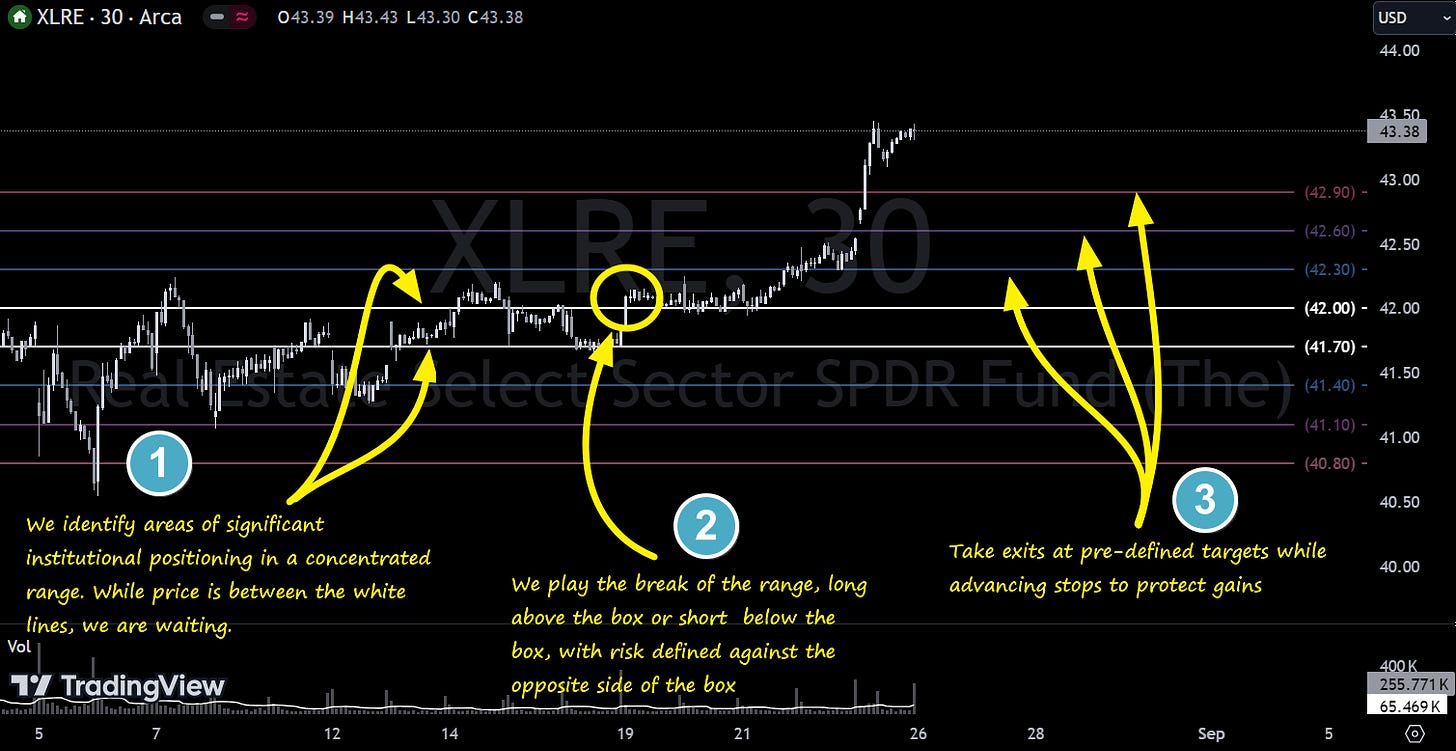
This week we’re featuring additional screened trade ideas from one of our backtested proprietary signals for tactical swings called IBB - Institutional Breakout Boxes. The IBB Setup identifies an area of significant institutional positioning within a tight, concentrated price range, forming what we call a breakout box. This setup captures the potential energy built up as large players accumulate or distribute positions, creating a high-probability opportunity for explosive moves once the price breaks out of this zone. The precision of this setup allows traders to capitalize on the momentum generated by institutional forces, with clearly defined risk and reward parameters. These trades typically last from 2-days to 2-weeks and given targets are designed for tactical swings. Moreover, for longer-term swing traders, these ideas often provide excellent entries that can help get you into risk-free runners quickly. I highly encourage you to revisit prior recommendations - there aren’t just a few big winners that kept running, there are many, all due to the power of institutional positioning.
Note, these are shared for educational and entertainment purposes only and do not constitute financial advice.Here’s an example from XLRE:
Let’s see how last week’s setups played out. If you took any of these yourself, let us know in the comments!
ACWI: ⭐⭐⭐ triggered long, +1.04%, all targets met; this continued to run for +3.35%
AAP: Triggered long, -2.08% right now and stuck in the breakout box. This can be stopped out manually and traders can wait for the breakout signal to re-trigger. We’re waiting for the hard-stop at the IBB low of $39.30.
ASPN: ⭐⭐, triggered long for +11.98%, T1+T2 achieved with a partial position left for a run at T3
BP: ⭐⭐, triggered long for +3.86%, T1+T2 achieved with a partial position left for a run at T3
CL:⭐⭐⭐, triggered short for +2.21%, all targets achieved. MFE on this was +3.54% for those holding runners beyond T3
CVS:⭐⭐, triggered long for +3.11%, T1+T2 achieved and runners stopped as price as returned to the IBB
DOCU: ⭐⭐, triggered long for +2.87%, T1+T2 achieved with a partial position left for a run at T3
EA: ⭐⭐⭐, triggered short for +2.29%, all targets achieved. This had a MFE of +4.58% for those holding runners beyond provided targets.
EEM:⭐, triggered long for +0.93%, T1 hit and runners still on for T2+T3
ELF: triggered short, currently +1.13%, all targets still open
HOLX:⭐⭐⭐, this one triggered long early in the week and went straight to T3 for +1.79%
HON:⭐⭐, triggered short for +1.06%, achieving T1+T2, runners stopped.
JNJ:⭐, triggered long and only scored T1 for +0.88%. All runners stopped.
KO: triggered short and no targets achieved before getting stopped.
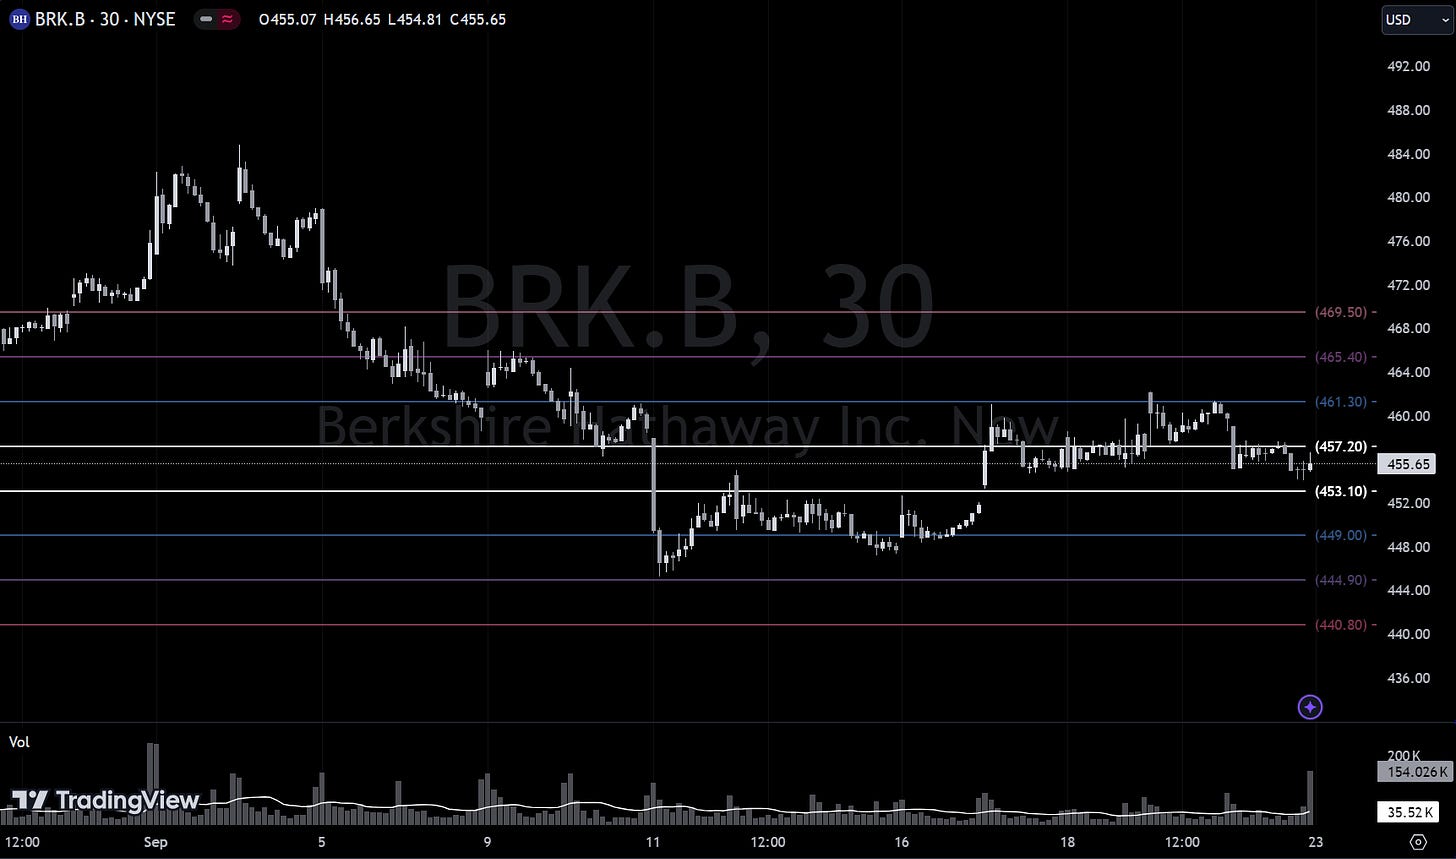
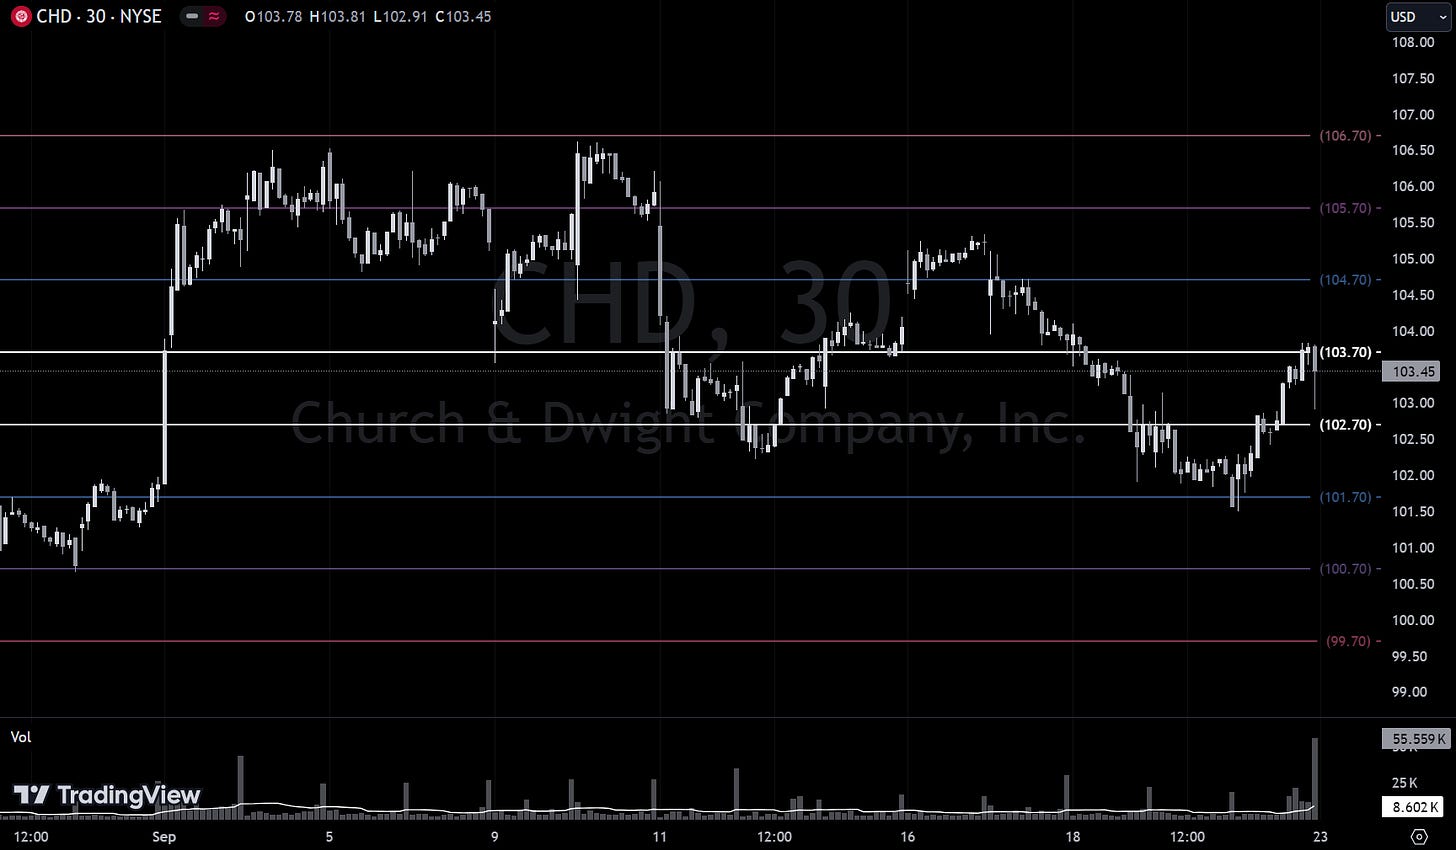
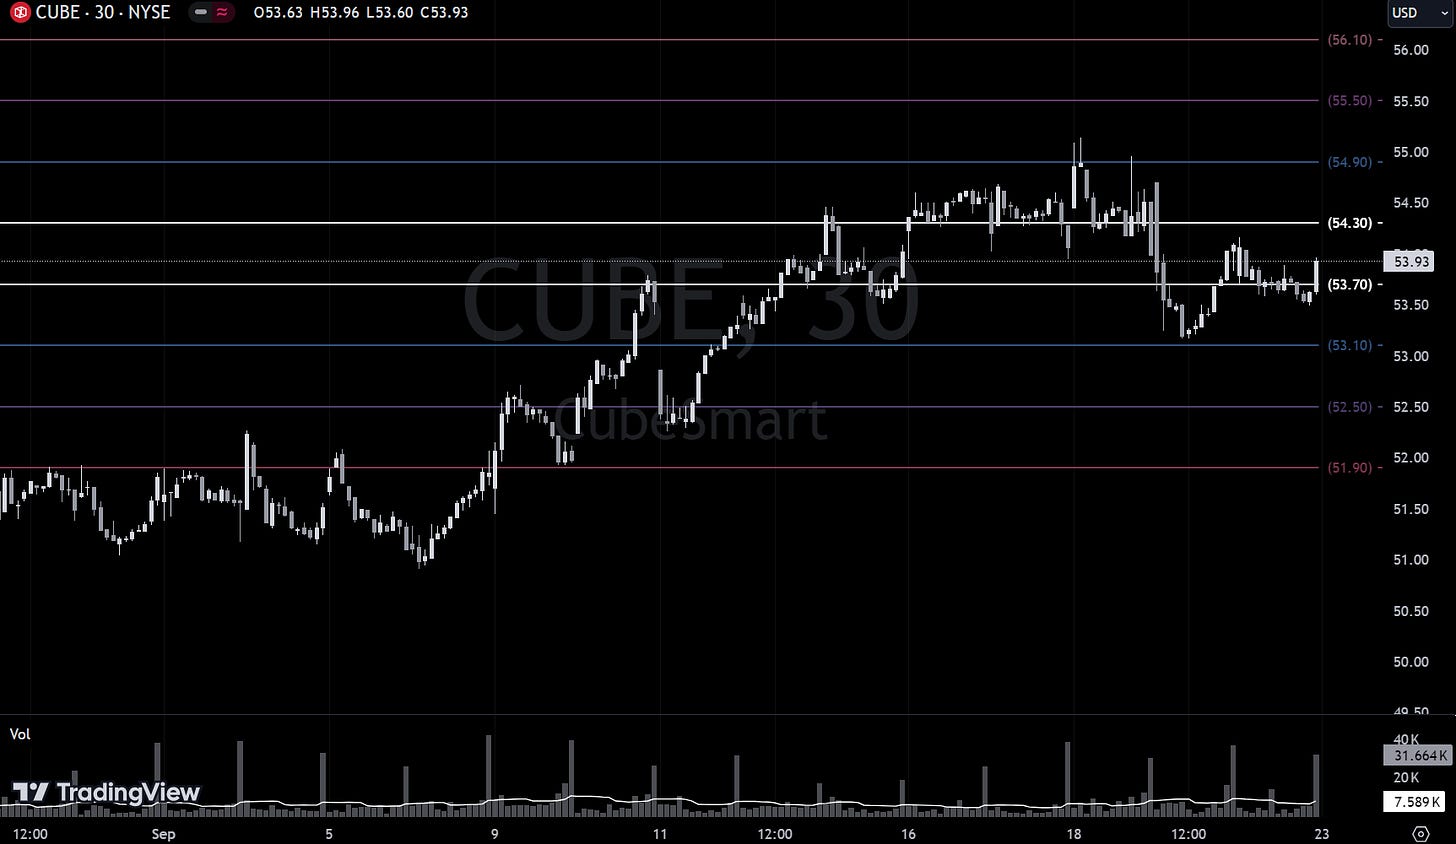
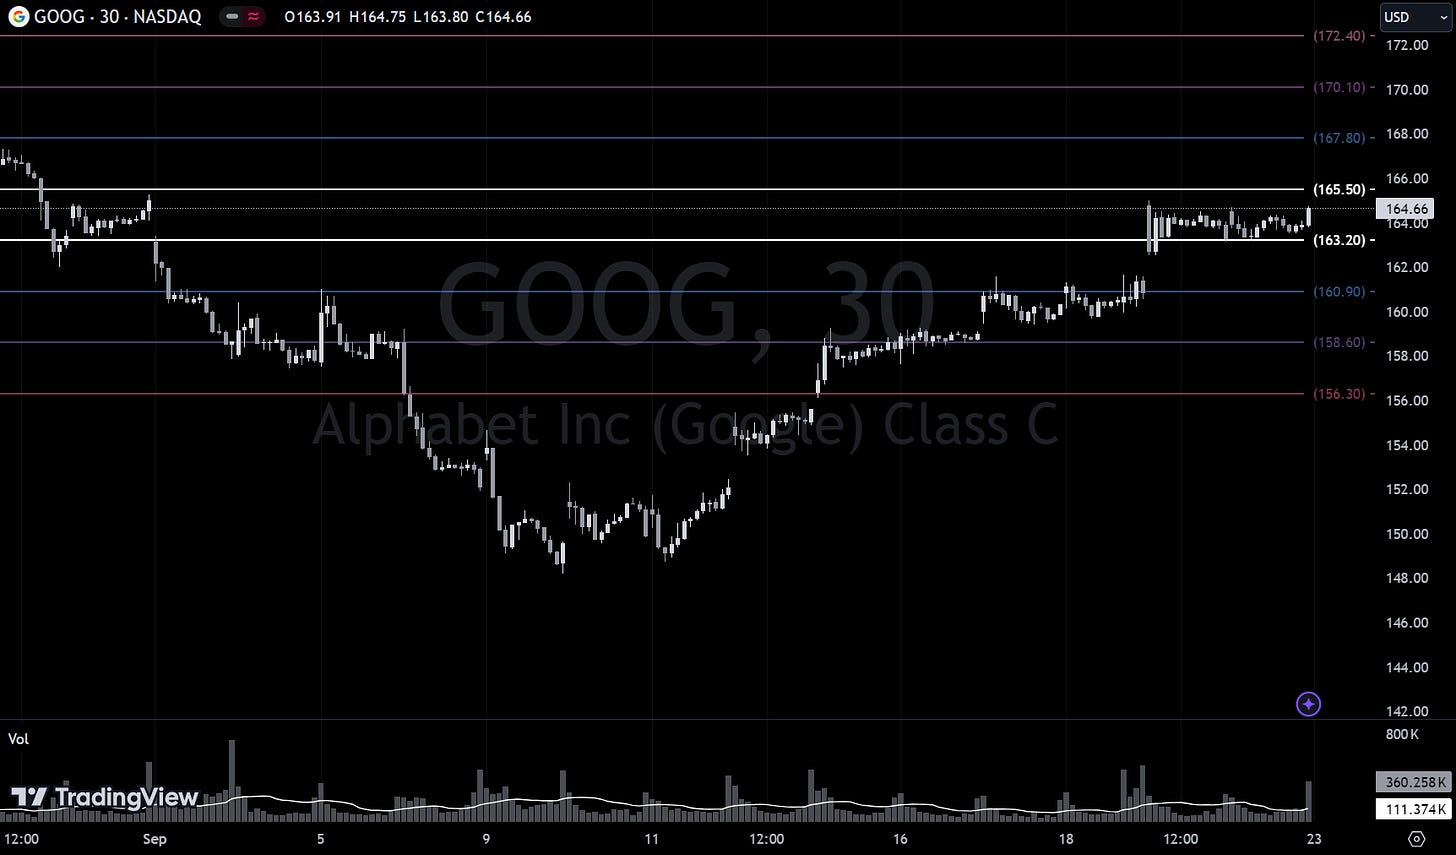
Not our best week in the short history of providing qualified trade ideas but still a strong showing in a tricky week loaded with important econ news. These are great weeks to revisit prior Precision Swings as they sometimes setup multiple times while institutions roll even larger and larger positions. Here are some of the Precision Swings we’re watching this week:
$BRK.B
Institutionally-Backed Gainers & Losers
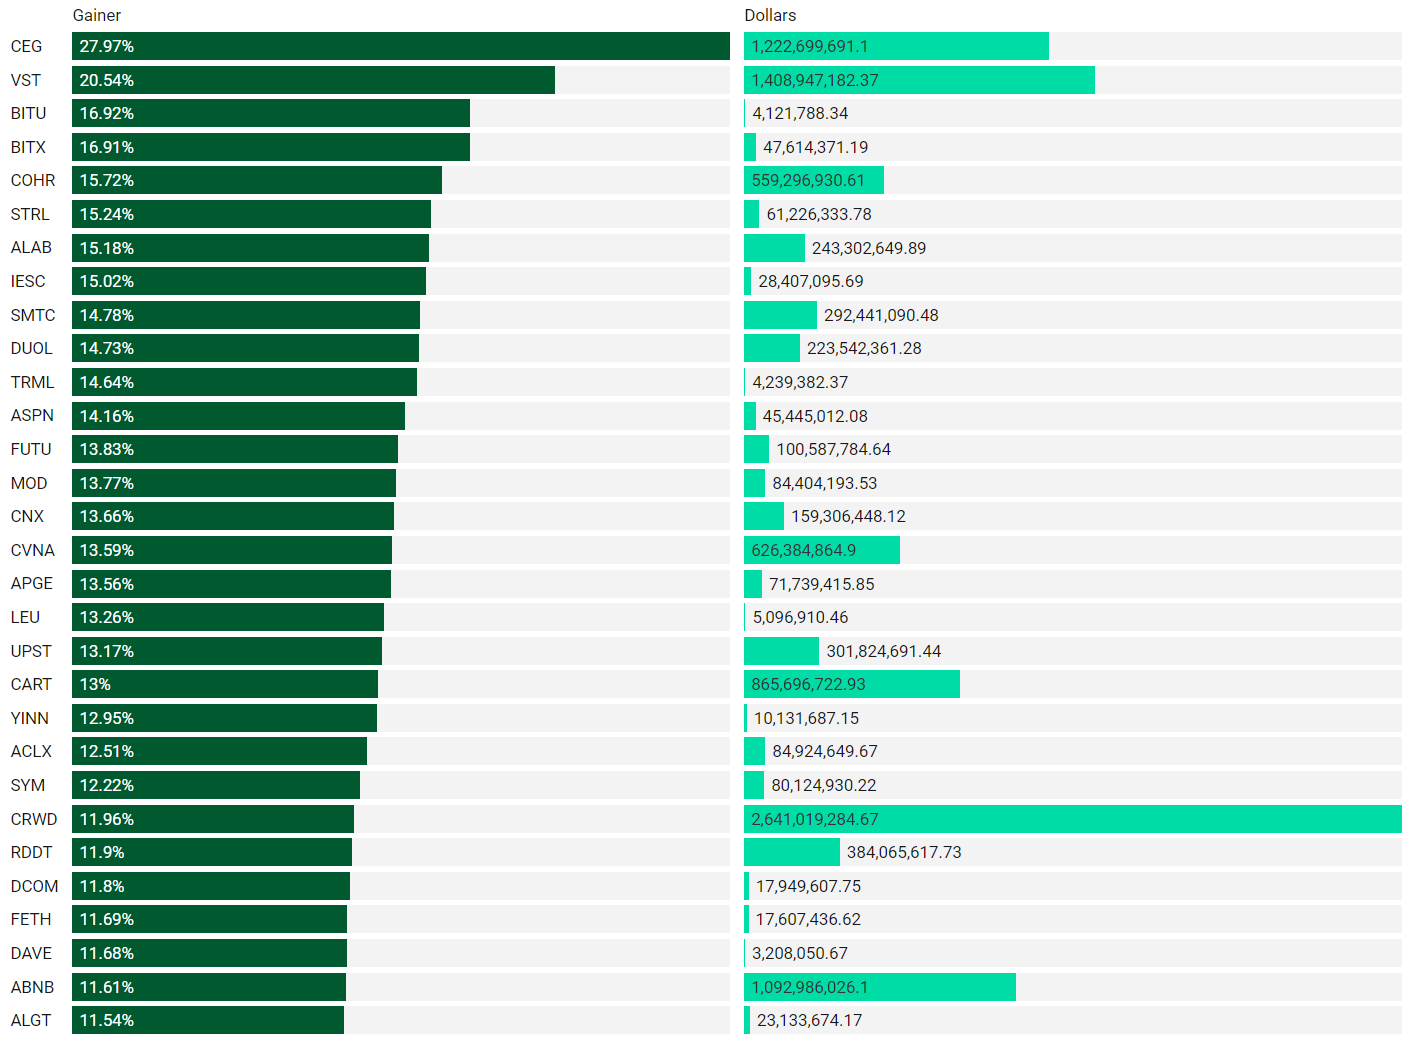
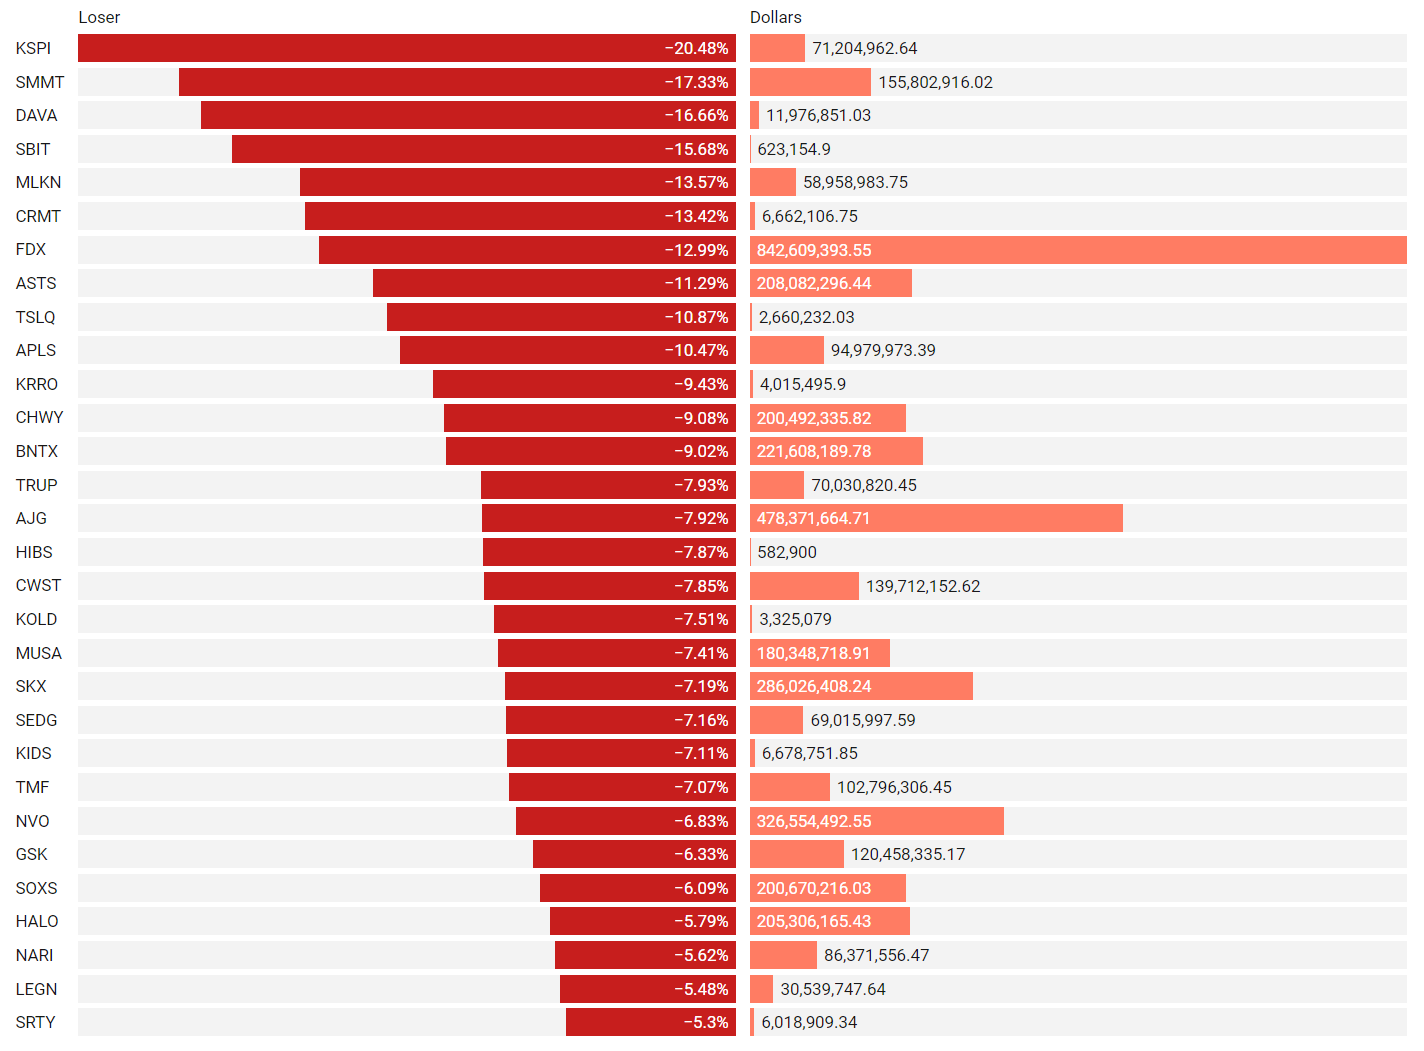
If you’re going to bet on a horse, consider one that is officially endorsed by an institution! These are the top percent gainers (green) and percent losers (red) from this week’s open-to-close that had a trade price greater than $20 and institutional involvement. Continue watching tickers from prior stacks as these frequently turn into multi-leg trades with a lot of movement!
Top Institutionally Backed Gainers
Top Institutionally Backed Losers
Billionaire Boys Club
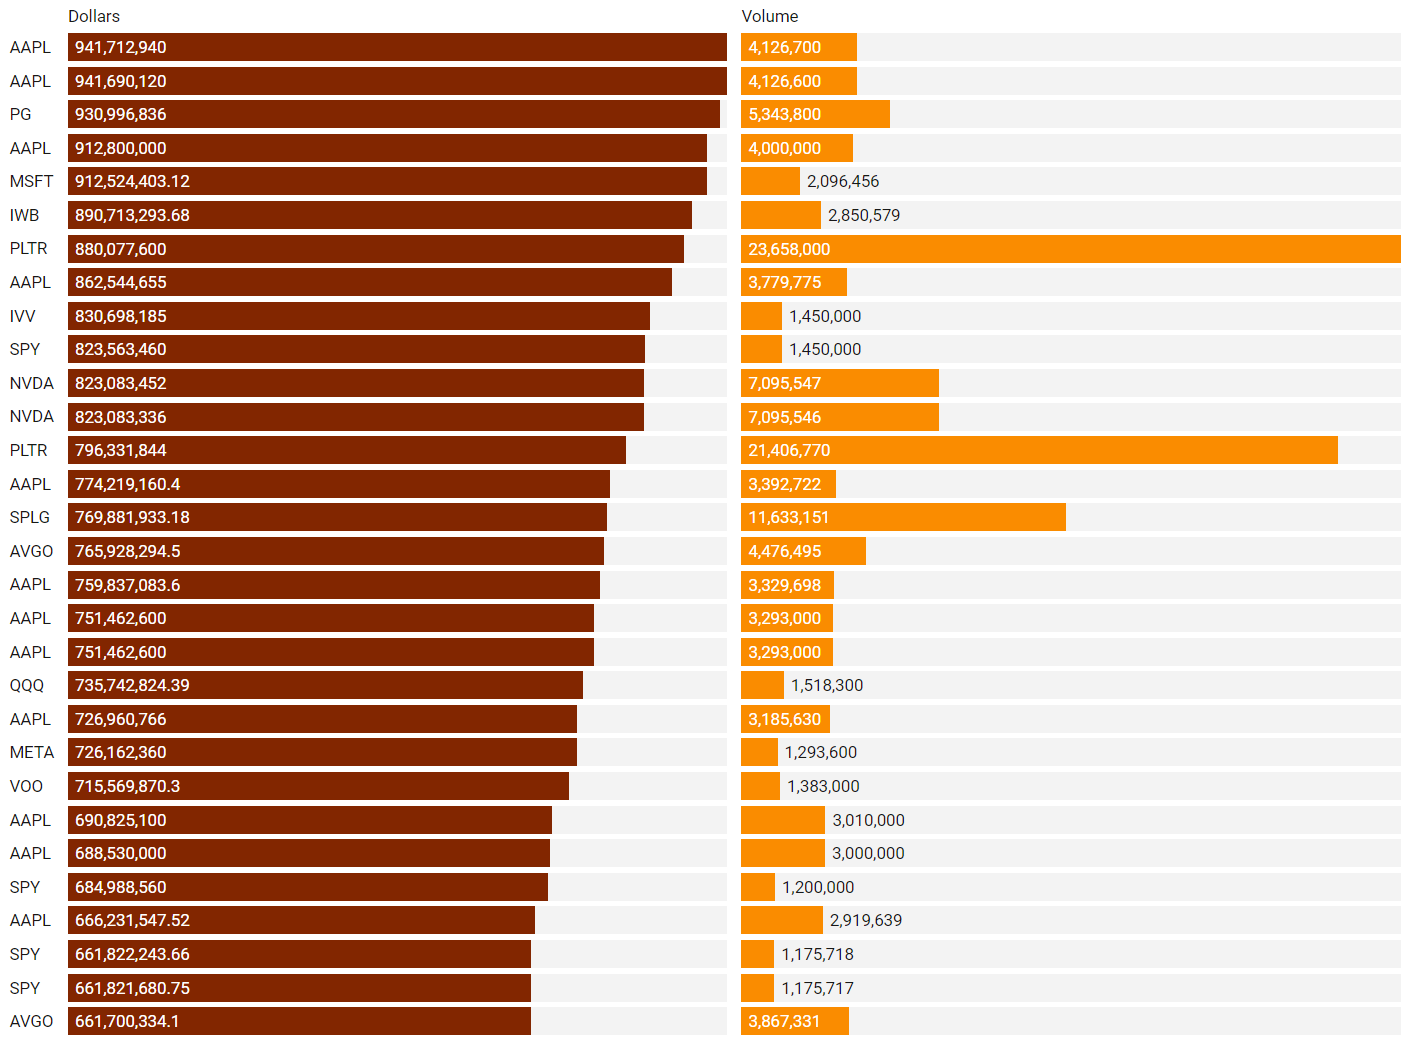
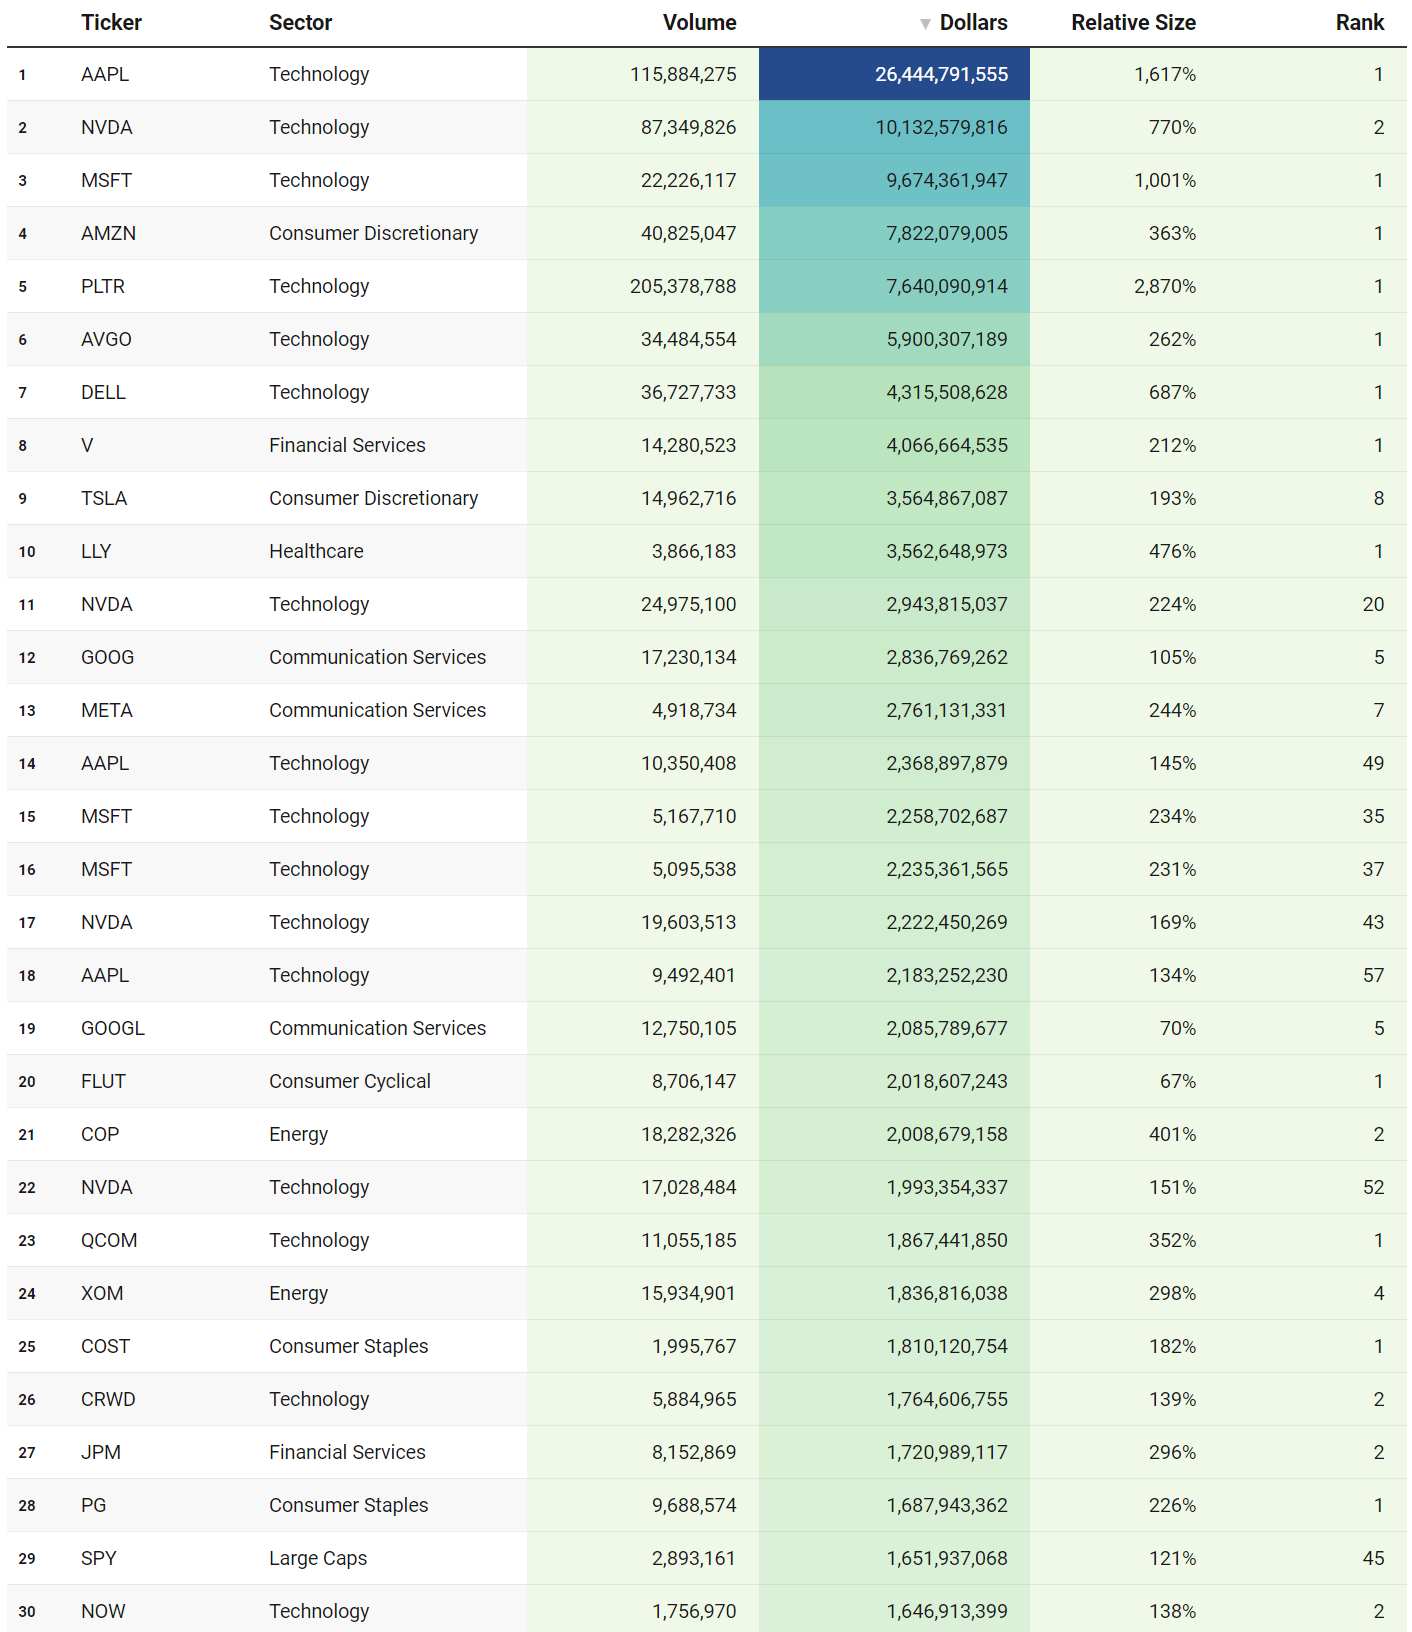
Tickers that printed a trade worth at least $1B last week get a special shout-out… Welcome to the club. Subs should login to VolumeLeaders.com to get the exact trade price and relevant institutional levels around the trade - these are massive commitments by institutions that should not be ignored.
I’m giving you 30 absolute monster trades from Opex for free. There are 39 more $1B+ trades inside the VolumeLeaders.com platform and dozens more that just missed the $1B-cut. You must login to see the rest of the trades and all of the context you need to dissect and trade around these positions. I guarantee you’ll want to see how institutions are positioned for the remainder of the year. This Opex did not disappoint…just look at the first row - #1 ranked AAPL trade of all time!
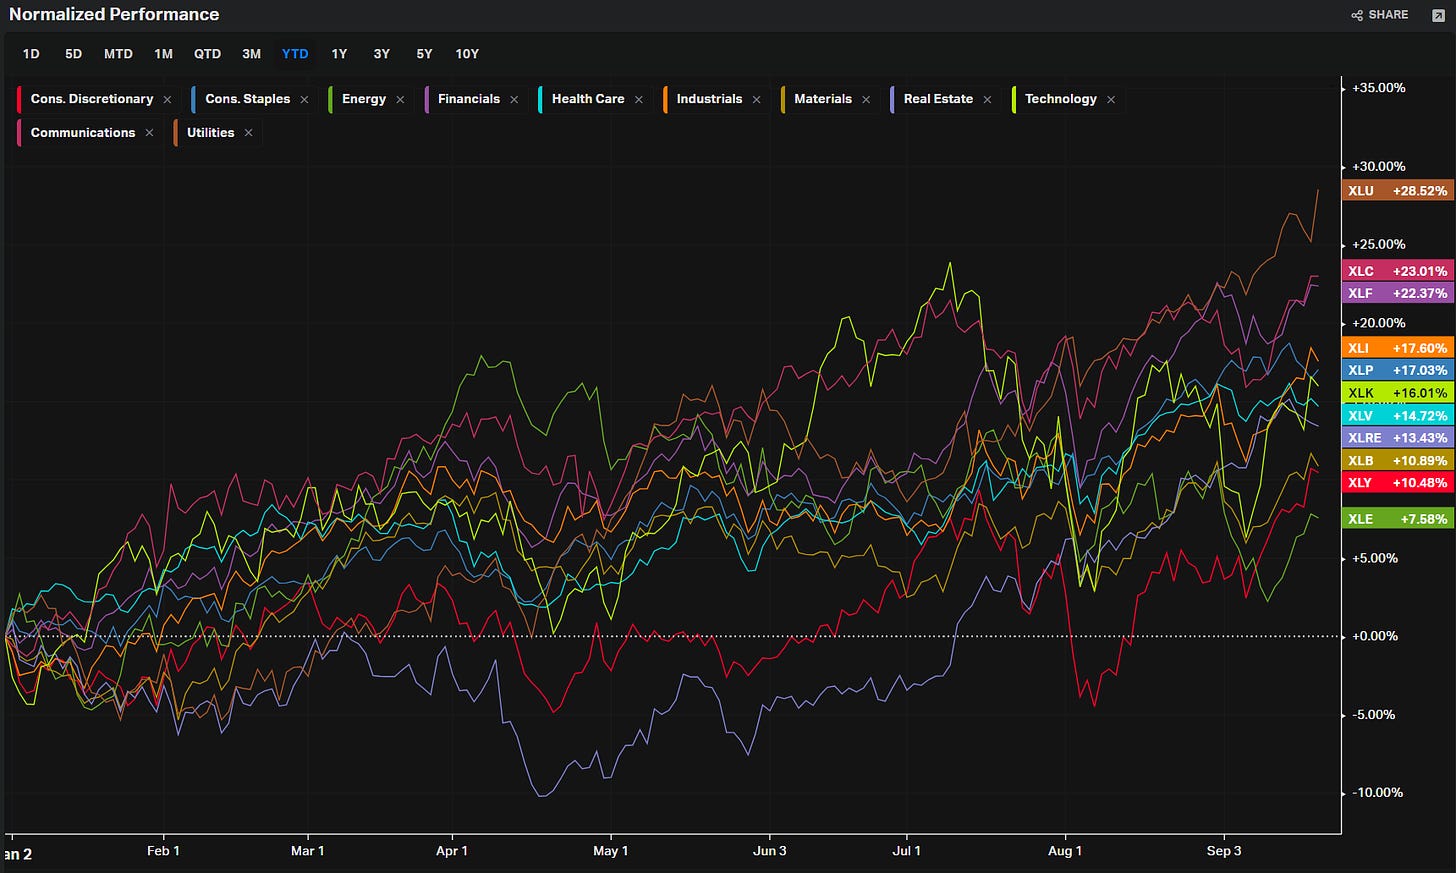
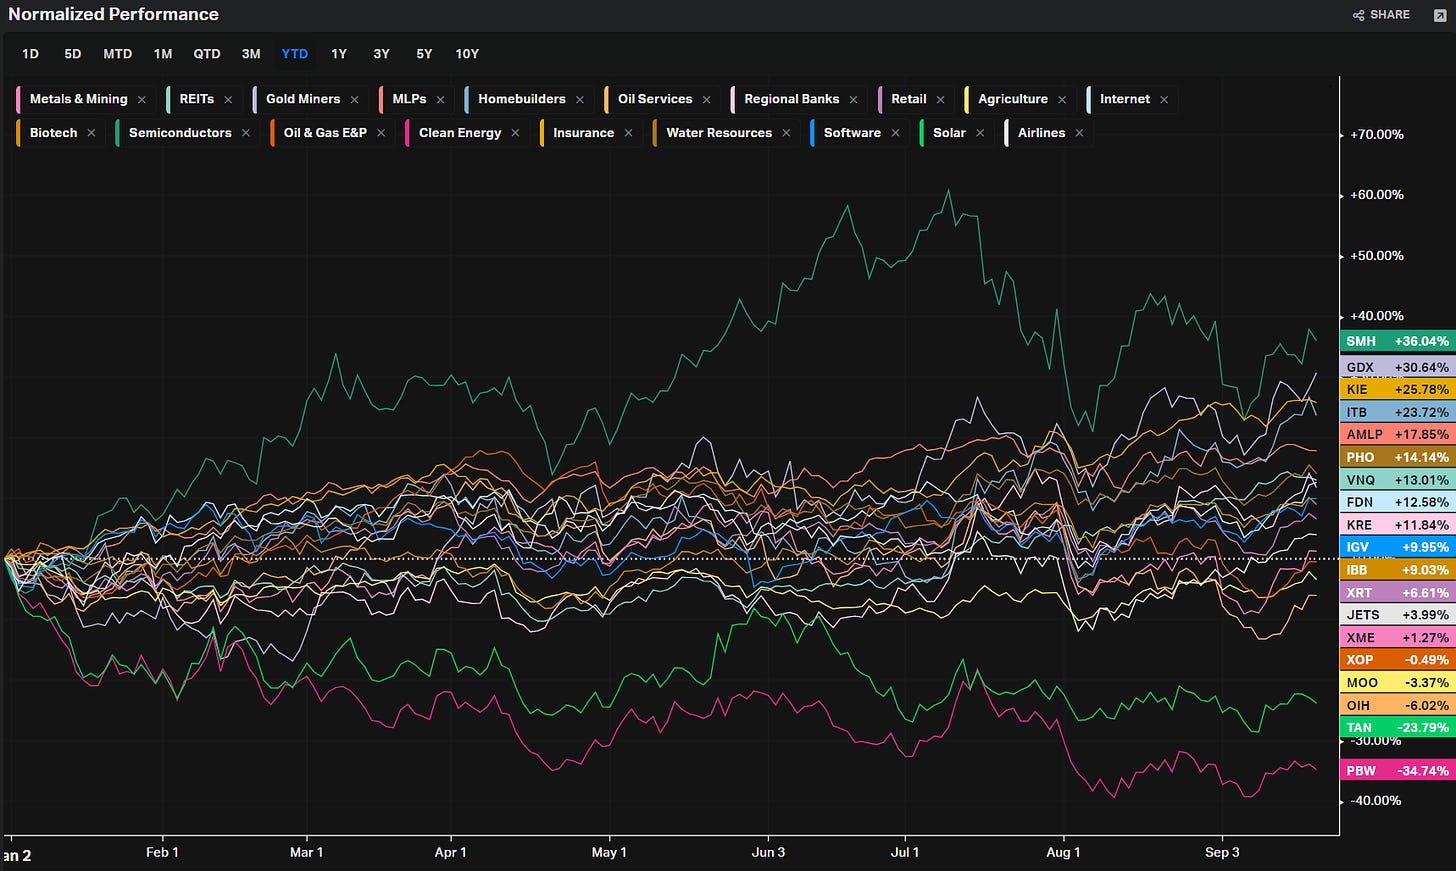
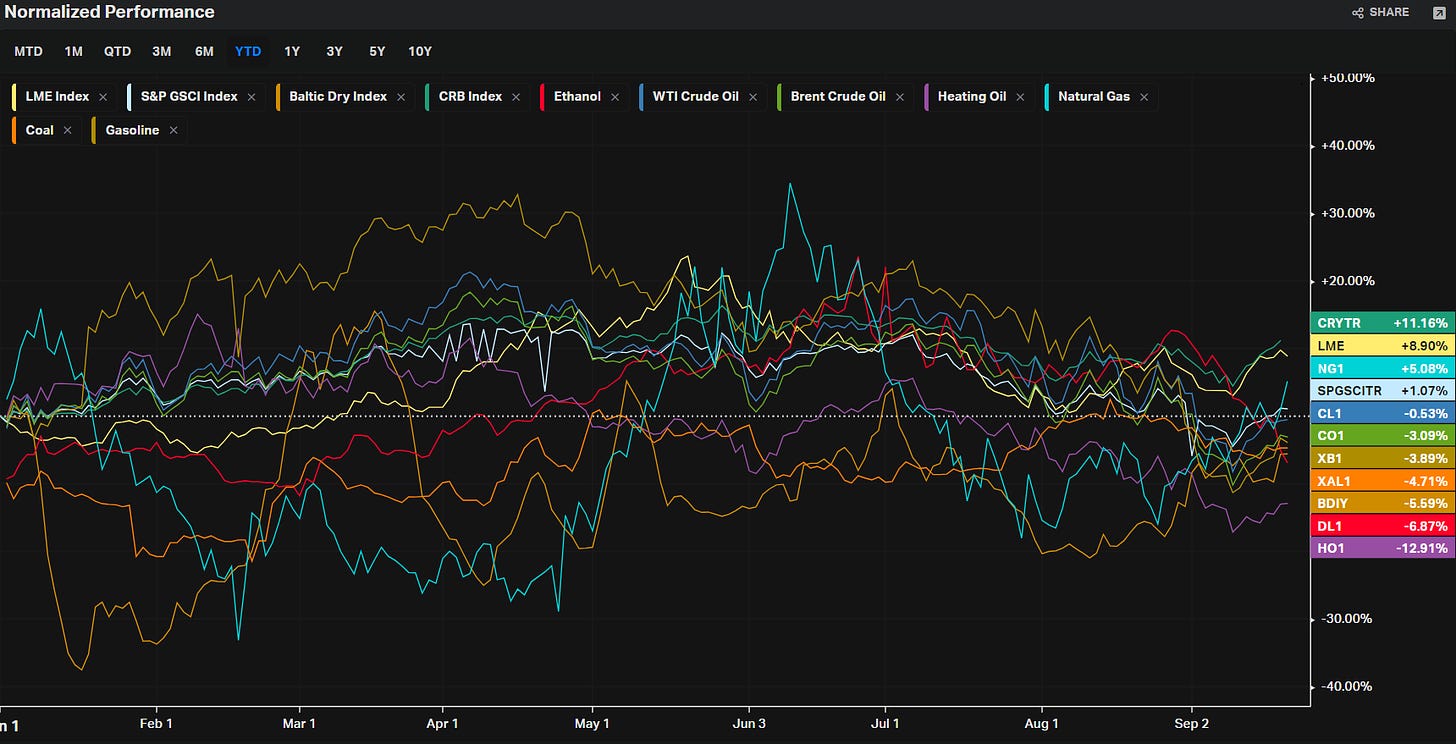
Summary Of Thematic Performance YTD
VolumeLeaders.com provides a lot of pre-built filters for thematics so that you can quickly dive into specific areas of the market. These performance overviews are provided here only for inspiration. Consider targeting leaders and/or laggards in the best and worst sectors, for example.
S&P By Sector
S&P By Industry
Energy
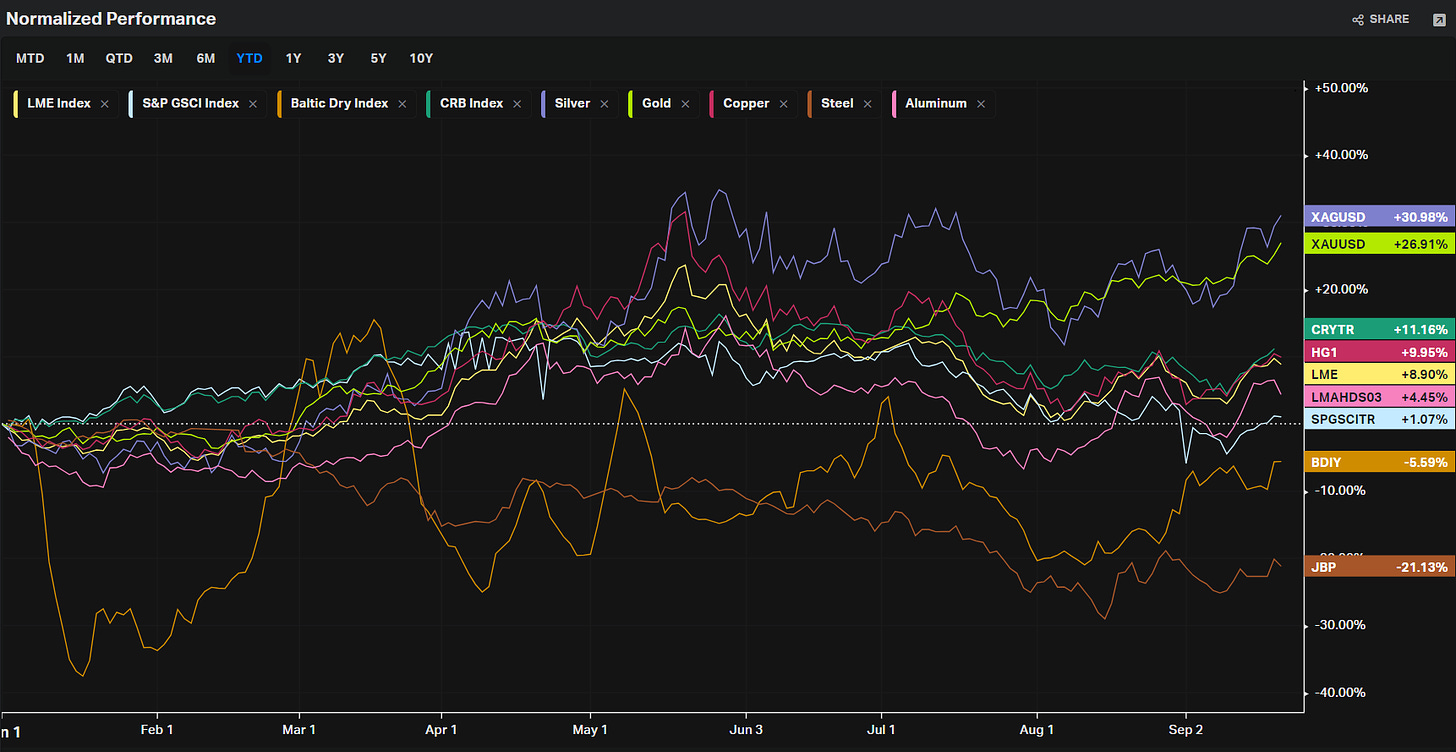
Metals
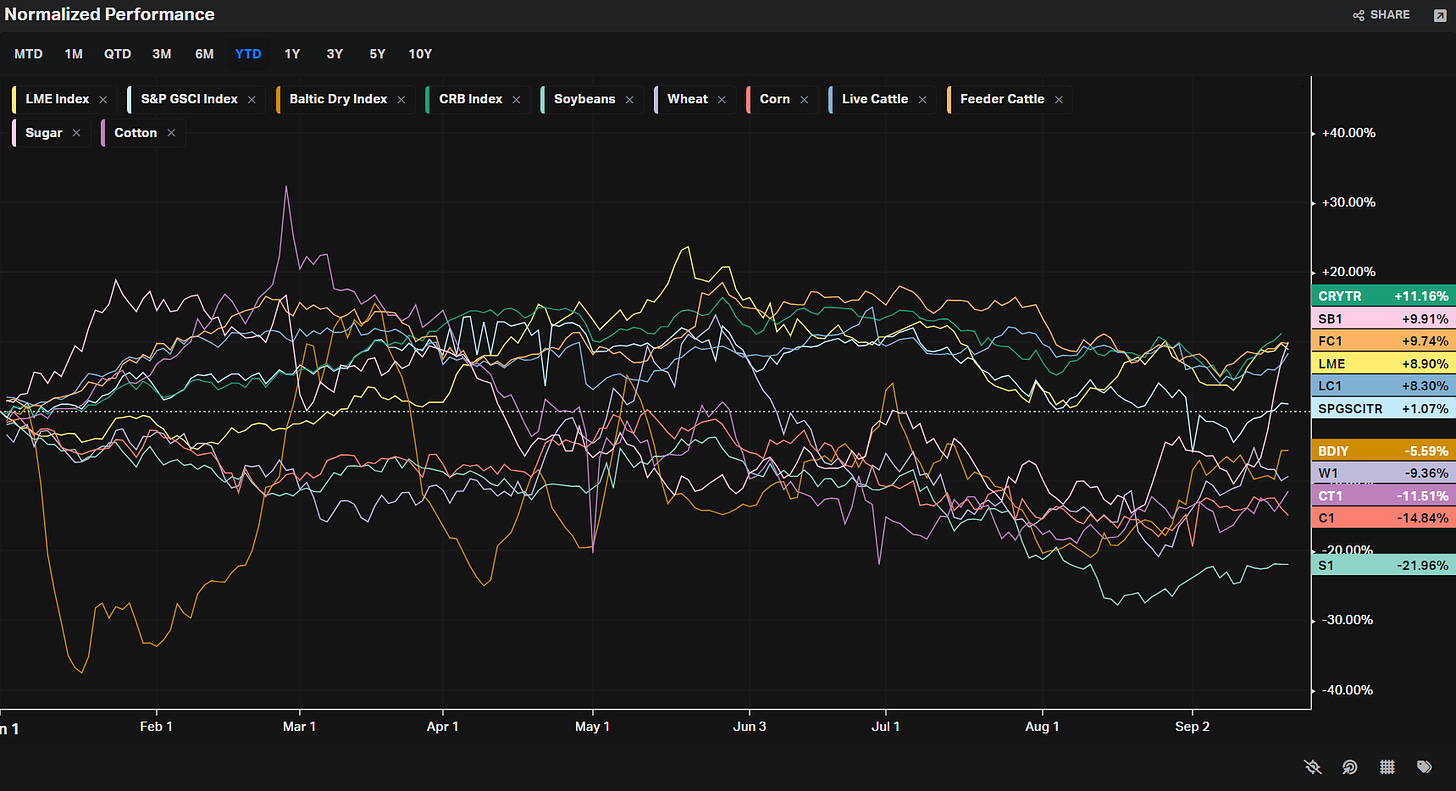
Agriculture
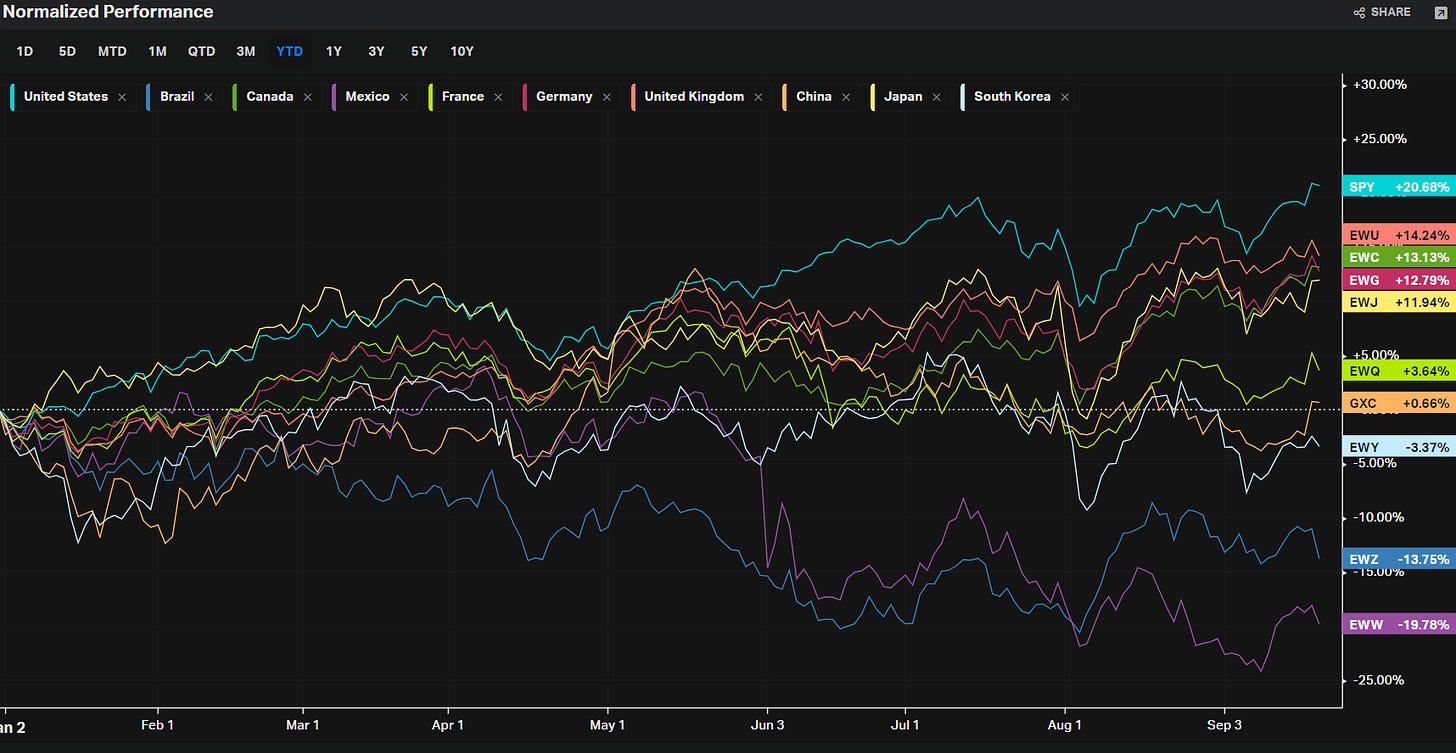
Country ETFs
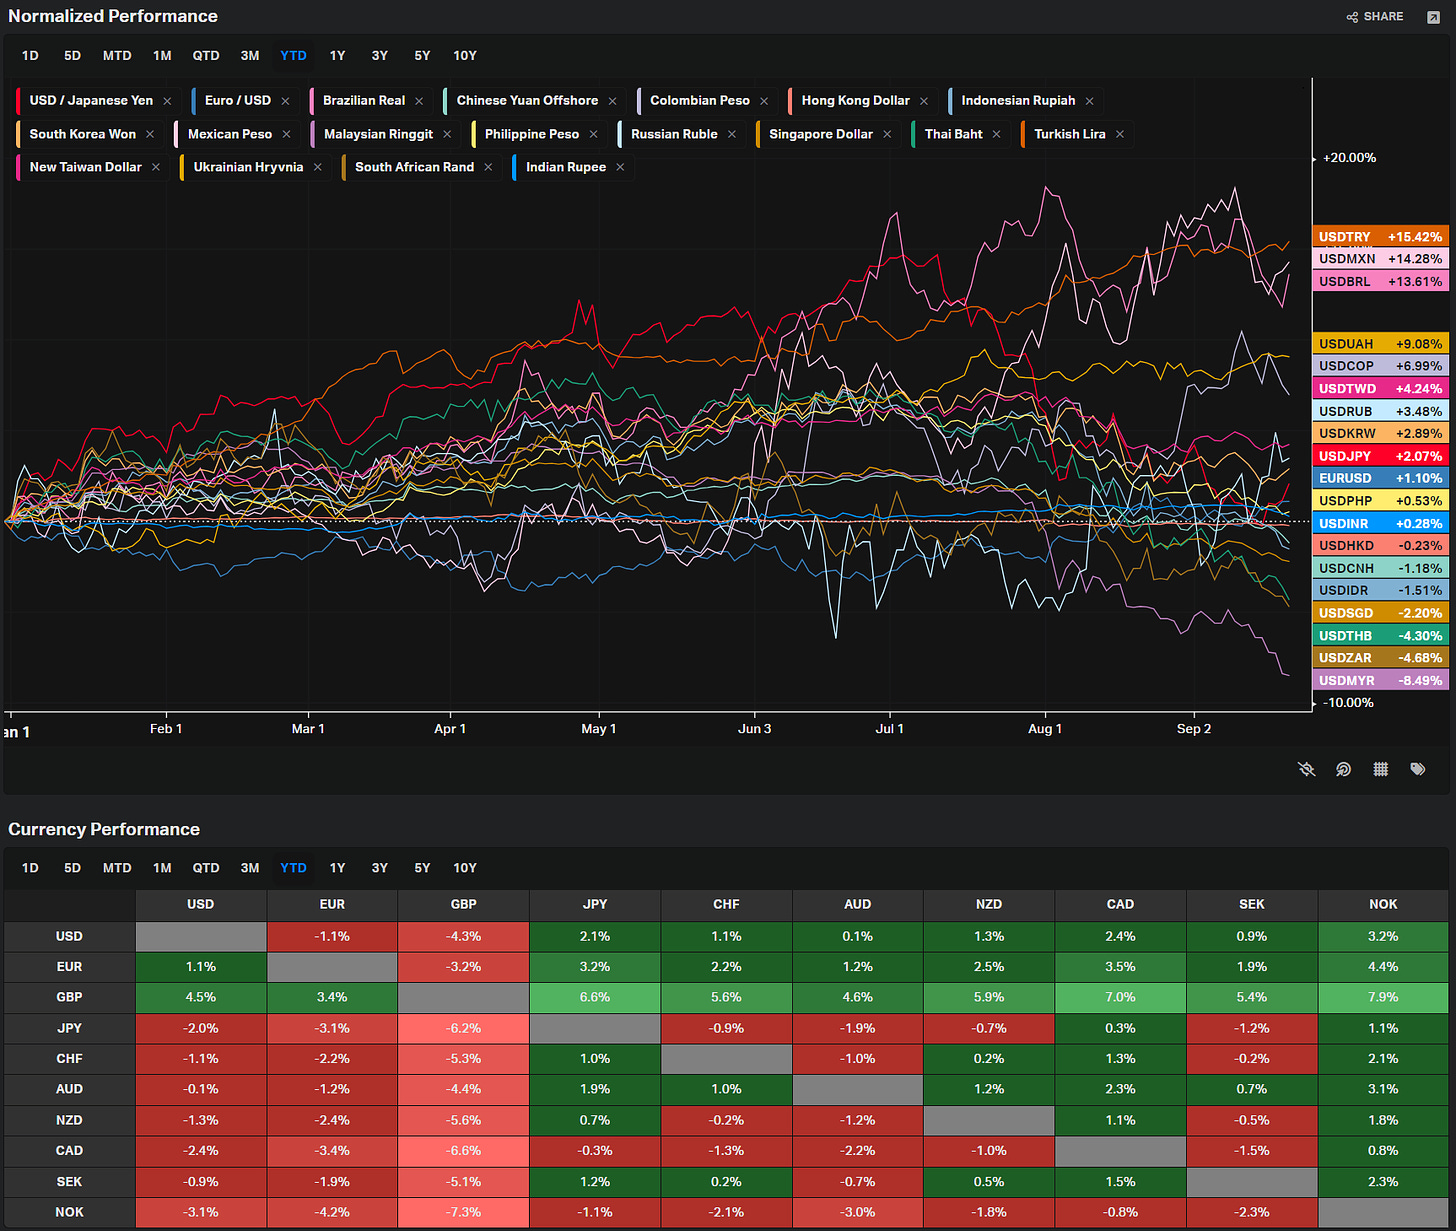
Currencies
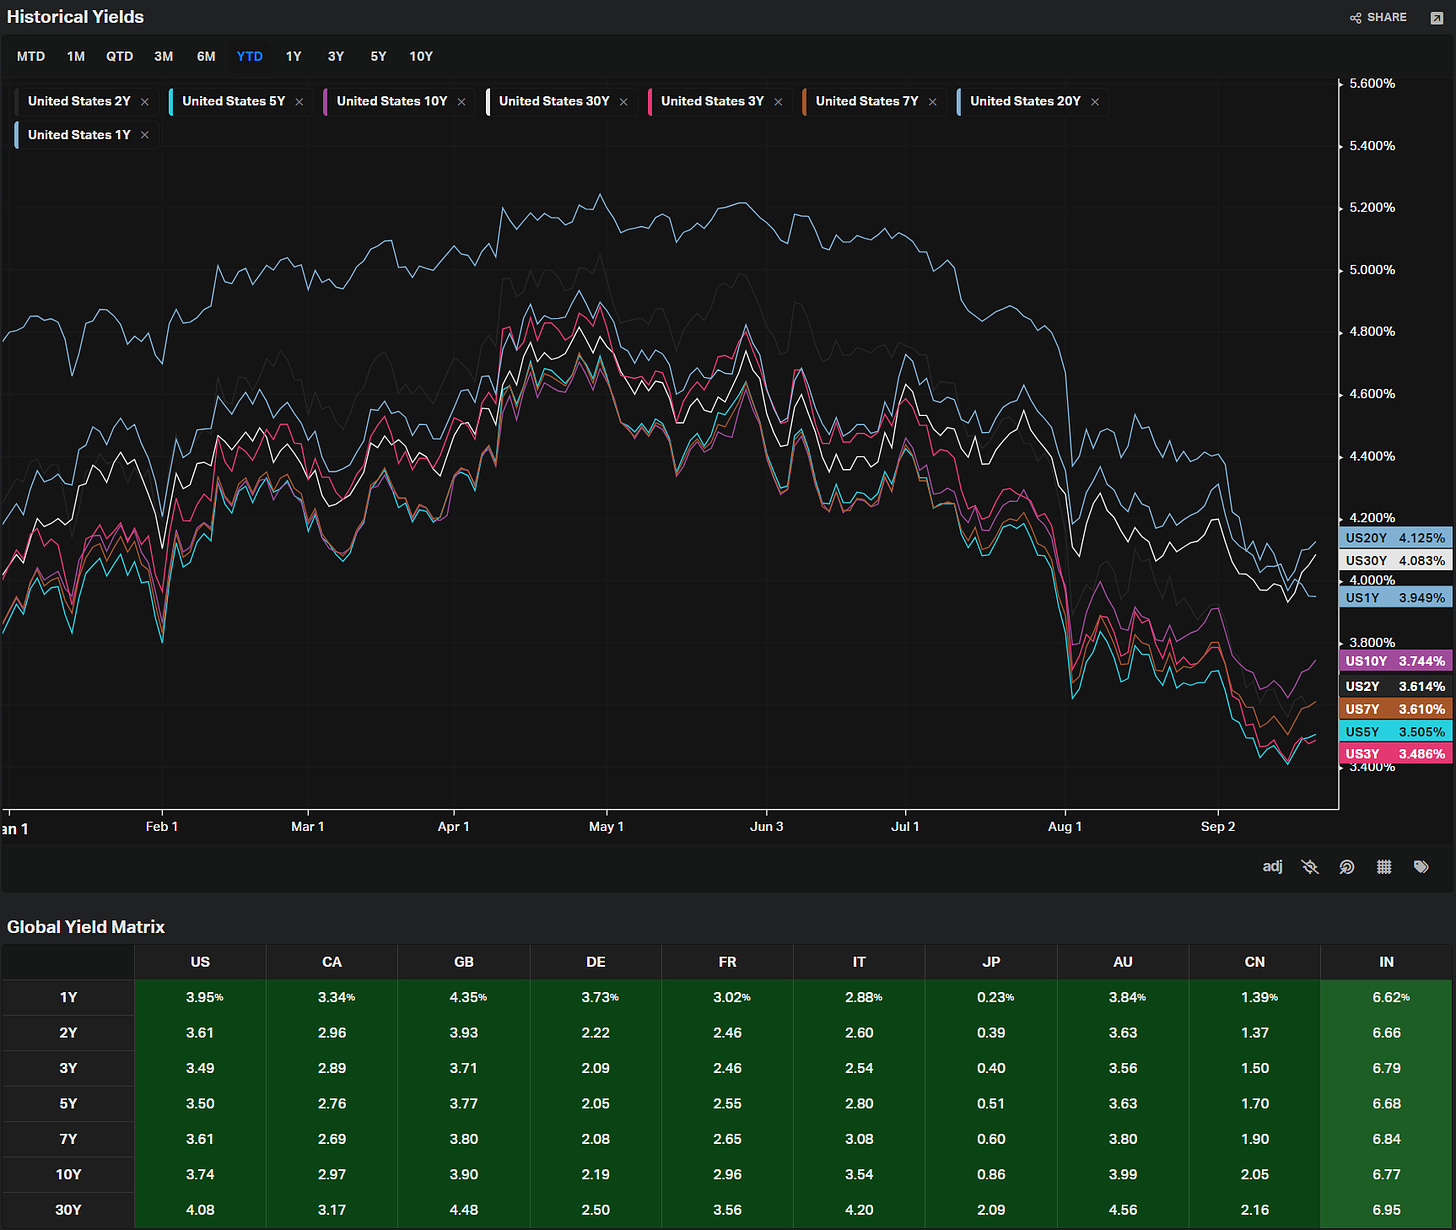
Yields
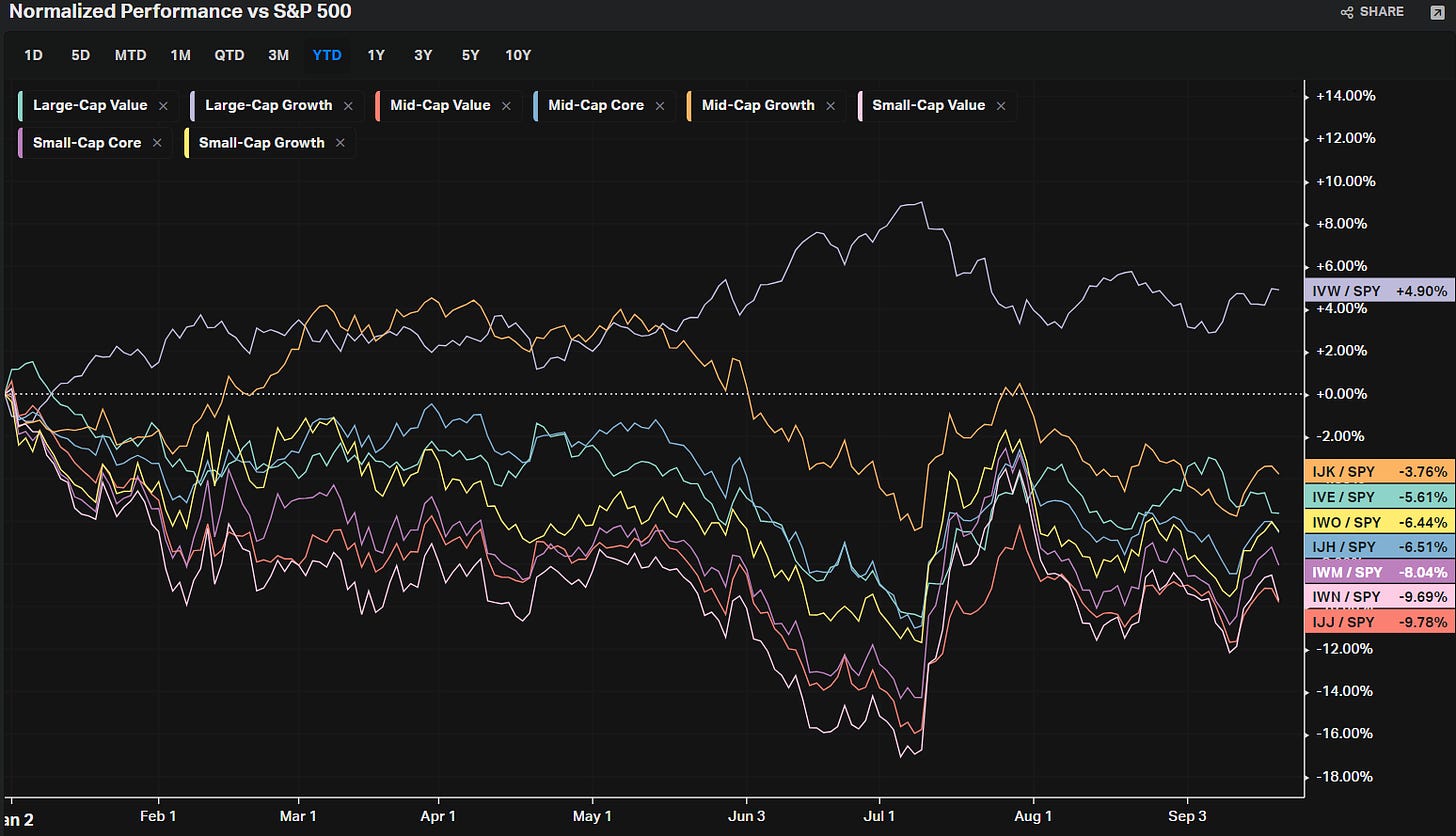
Factors: Size vs Value
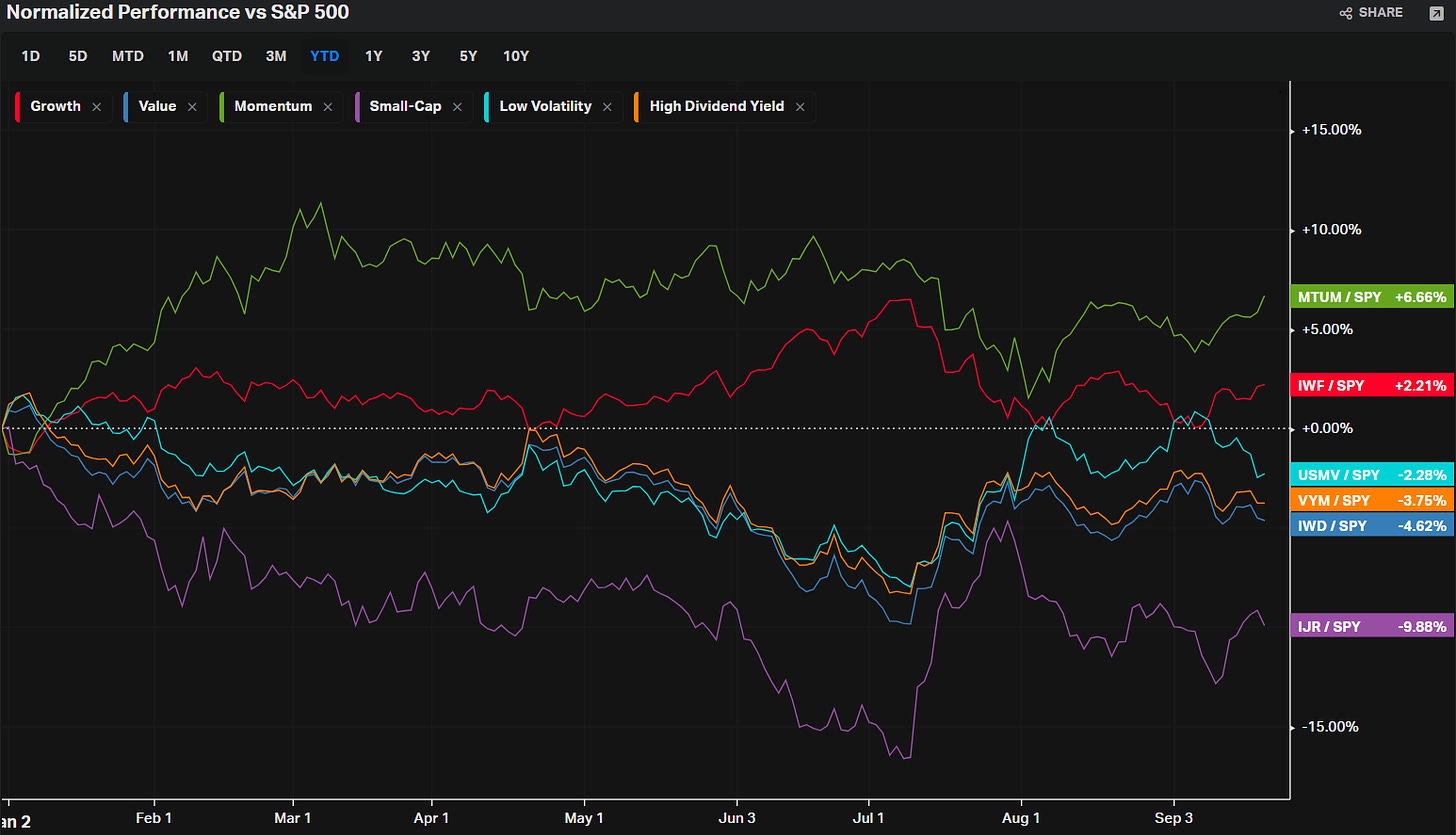
Factors: Style
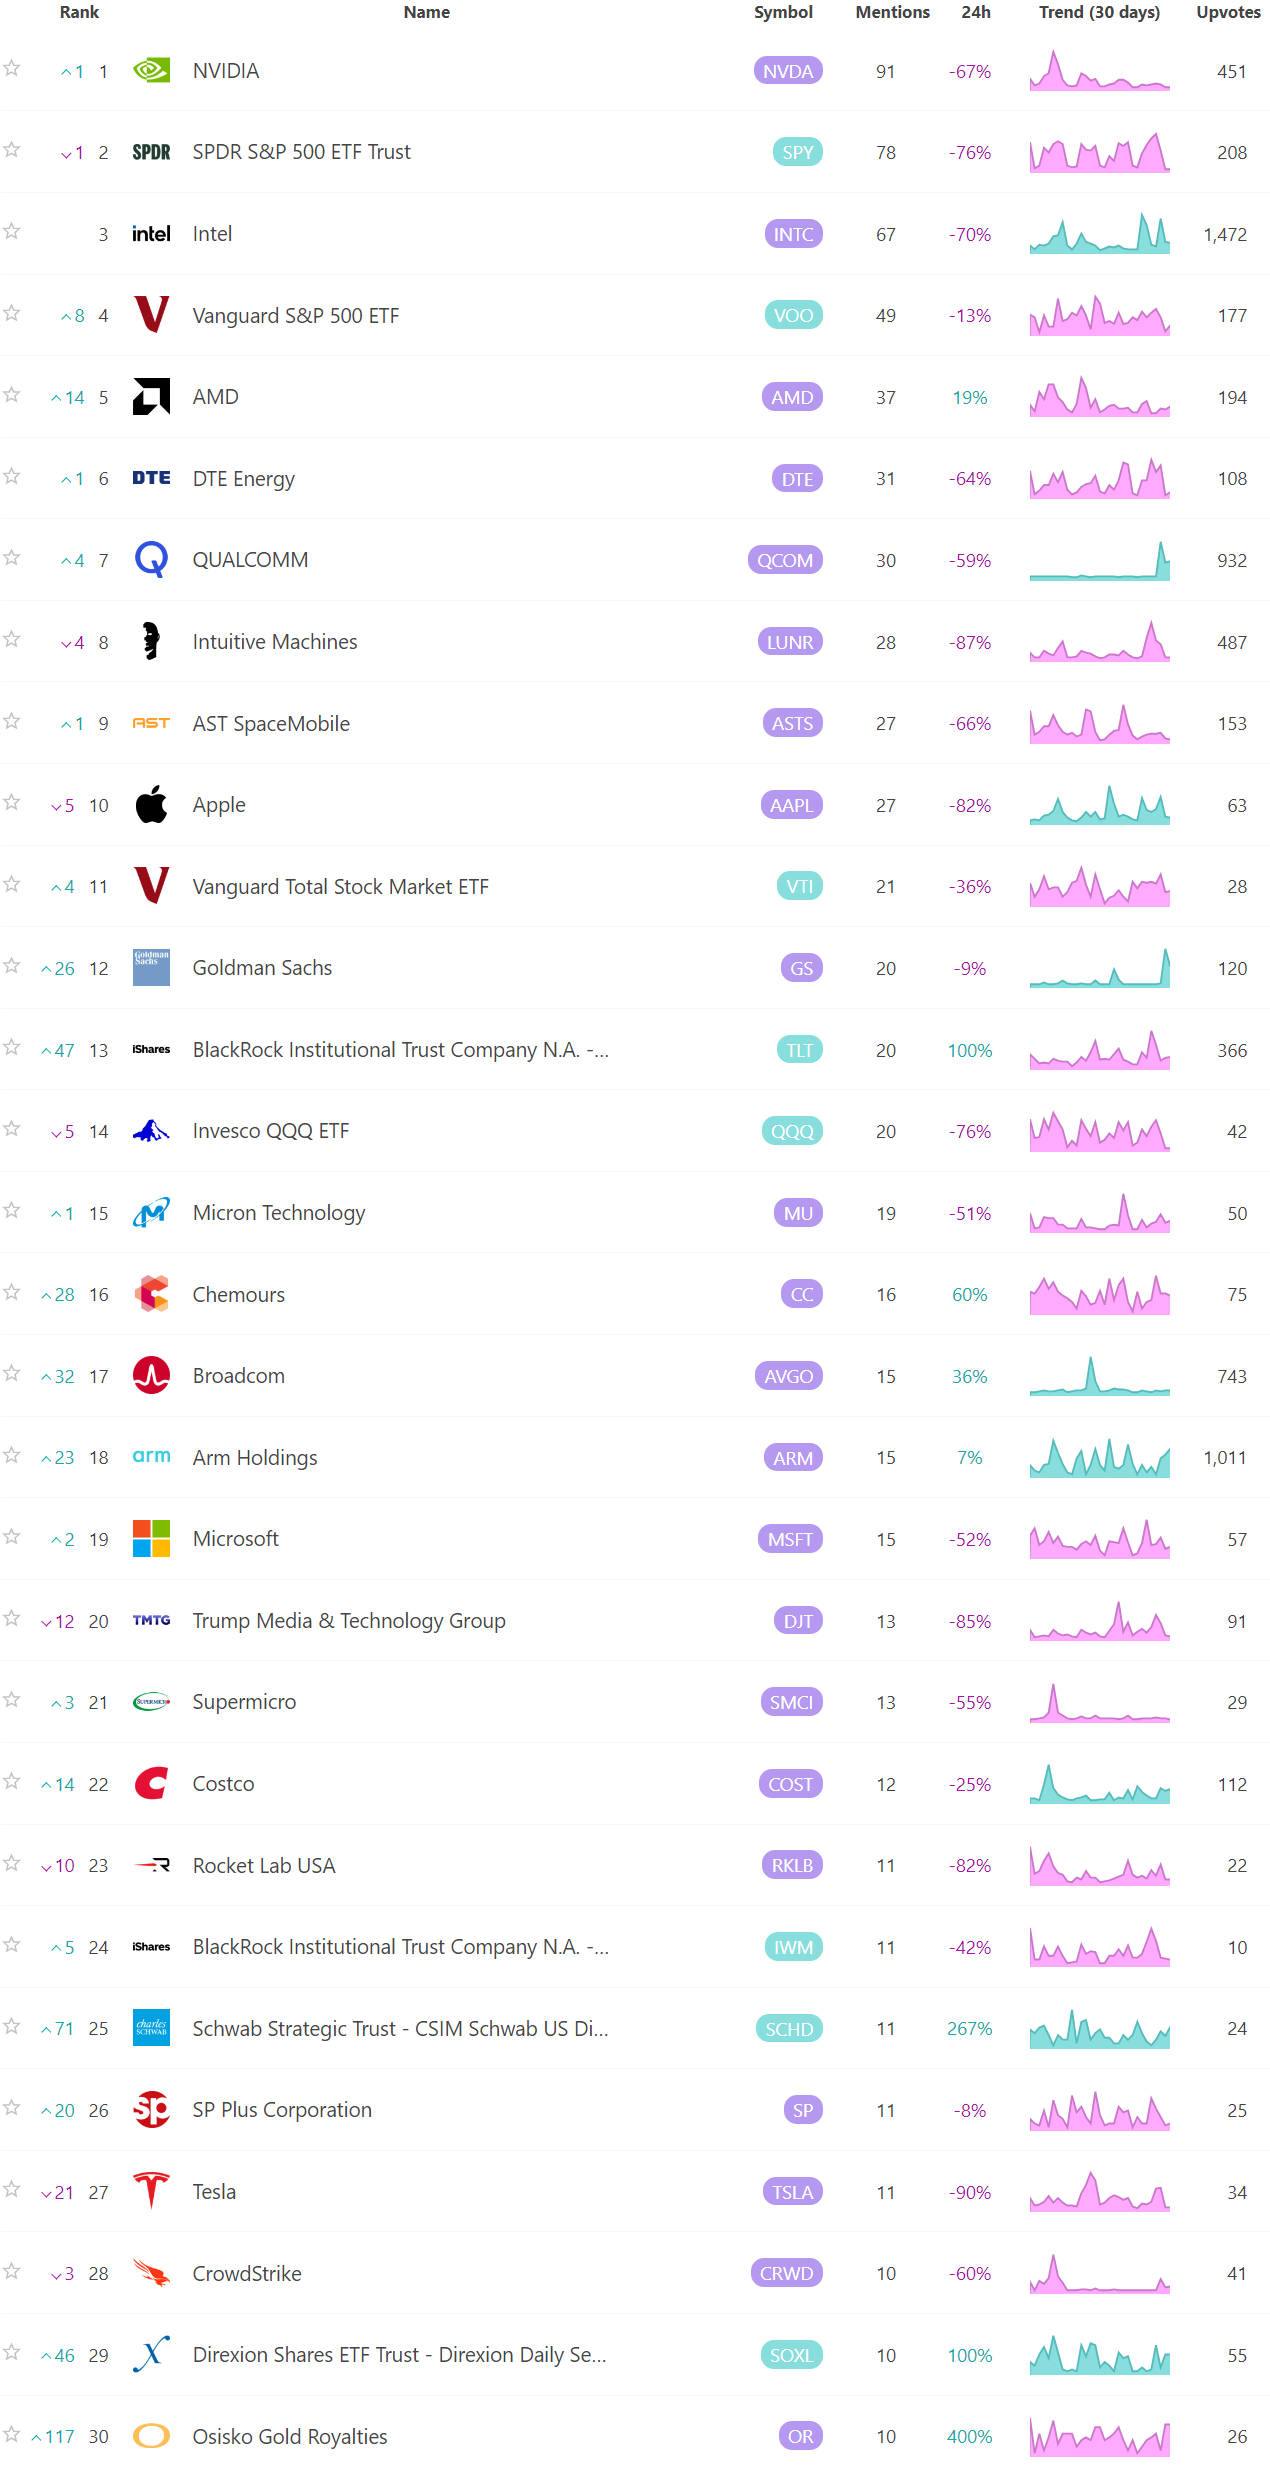
Social Media Favs
Most mentioned/discussed tickers on Reddit from some of the most active Subreddits for trading:
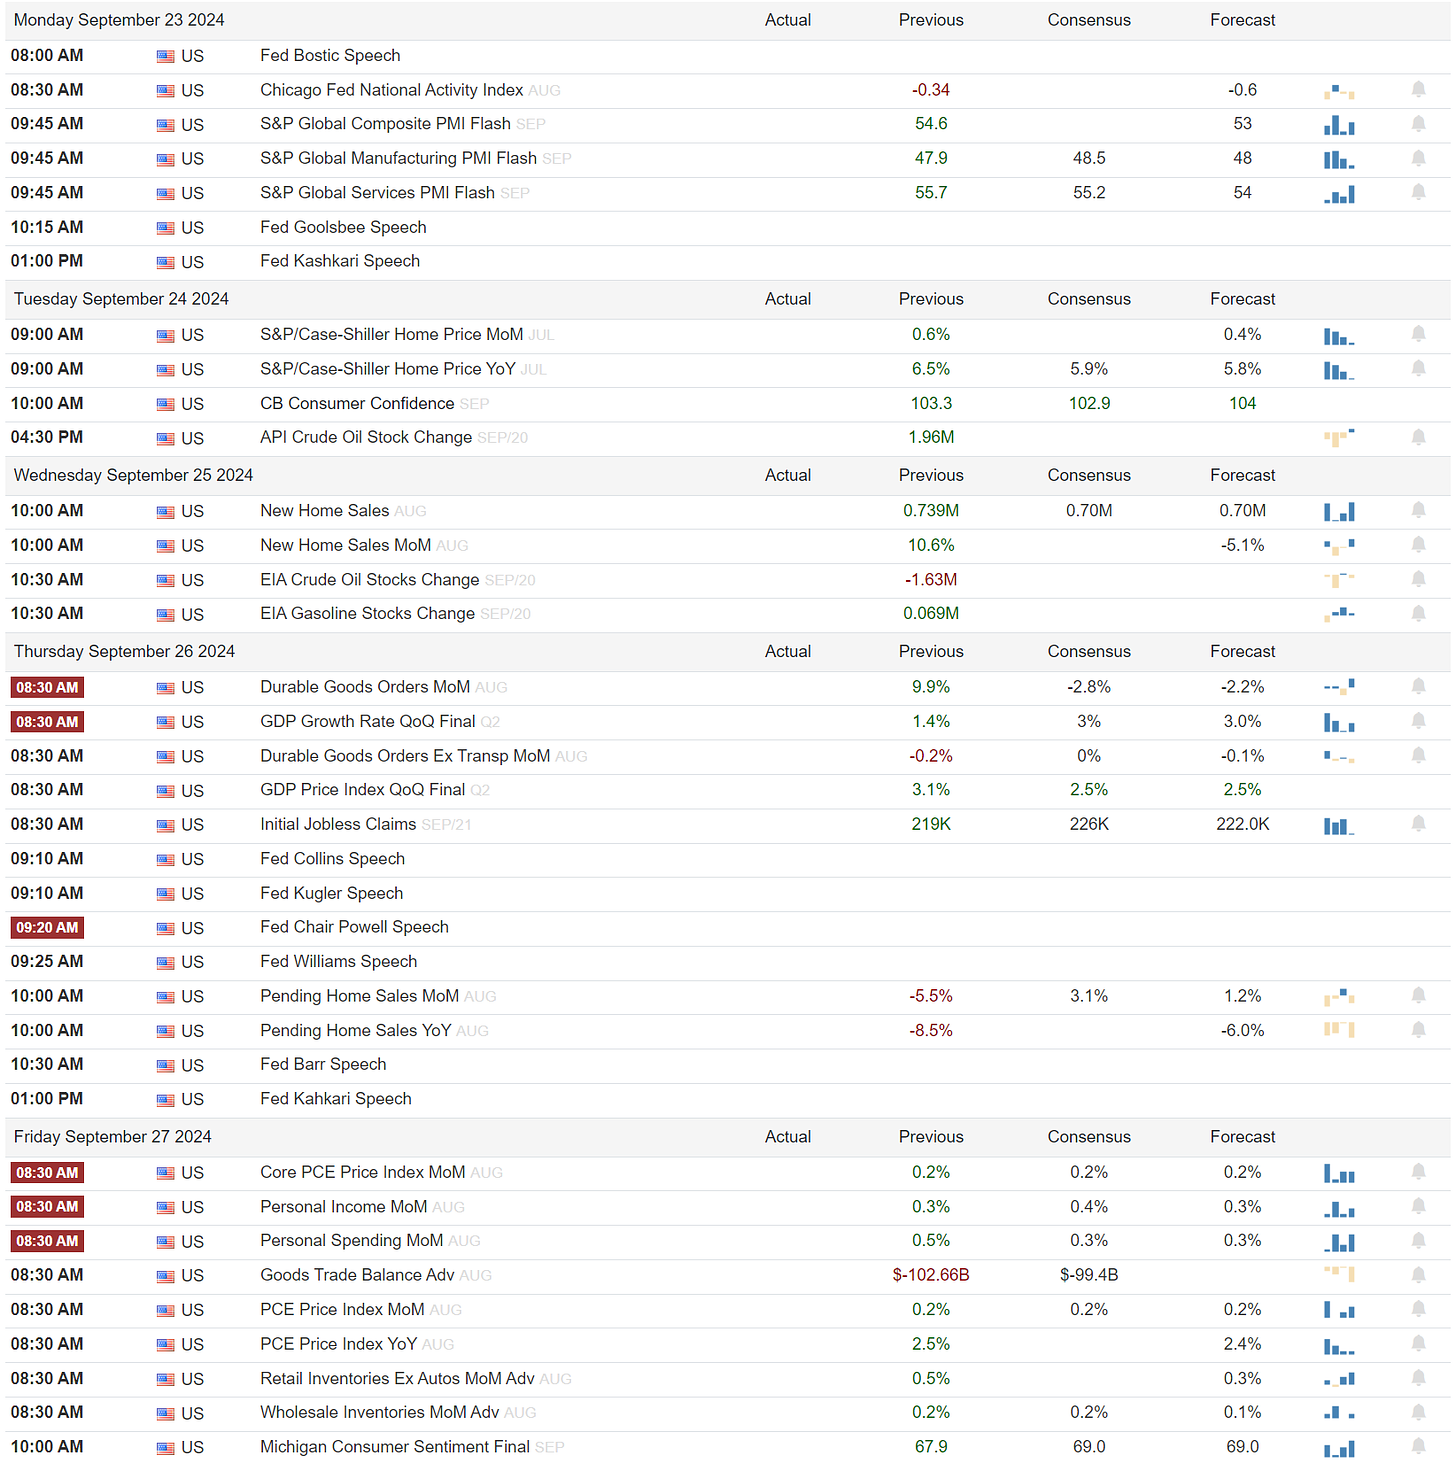
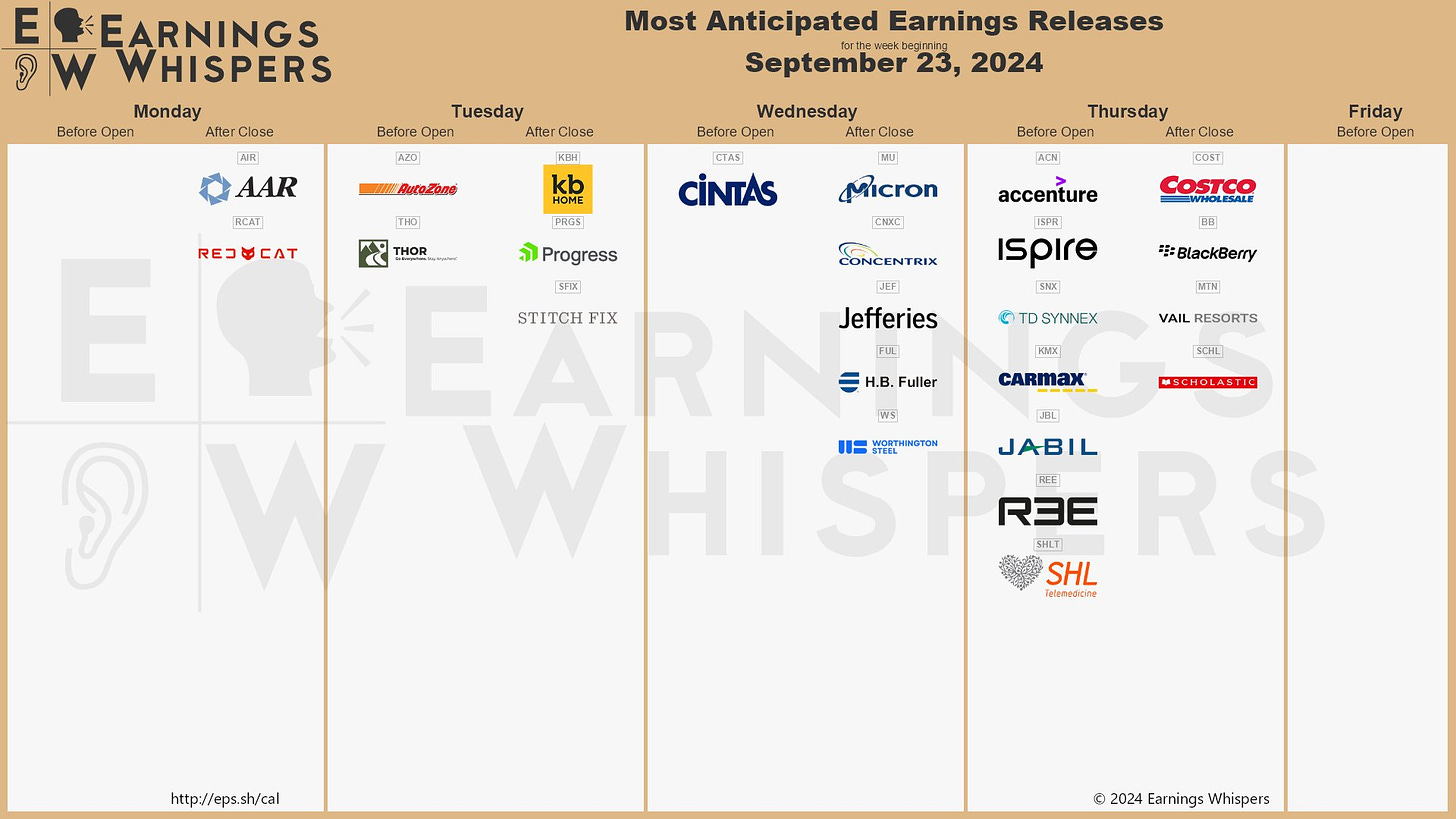
Events On Deck This Week
Here are key events happening this week that have the potential to cause outsized moves in the market or heightened short-term volatility.
Econ
Earnings
A Final Word
Thank you for reading this week's edition of Market Momentum. If you found value in this content, please consider sharing it with a friend or colleague, in a Discord or a Tweet. This small favor helps keep this stack free for you! Please check out VolumeLeaders.com for your own free trial of the platform that brings you the data powering this stack. Wishing you all a green week ahead filled with many bags ❤️💰.


