


Market Momentum: Your Weekly Financial Forecast & Market Prep
Issue 38 / What to expect March 24, 2025 thru March 28, 2025
In This Issue
Market-On-Close: All of last week’s market-moving news and macro context in under 5 minutes + futures-at-a-glance
The Latest Investor Sentiment Readings
Institutional Support & Resistance Levels For Major Indices: Exactly where to look for support and resistance this week in SPY, QQQ, IWM & DIA
Institutional Activity By Sector: Institutional order flow by sector including the top institutionally-backed names in those sectors. We break it all down and provide the key insights and take-aways you need to navigate institutional positioning this week.
Top Institutional Order Flow In Individual Names: All of the largest sweeps and blocks on lit exchanges and hidden dark pools
Investments In Focus: Bull vs Bear arguments for CDNS, RDFN, WOLF
Top Institutionally-Backed Gainers & Losers: An explosive watchlist for day traders seeking high-volatility
Normalized Performance By Thematics YTD (Sector, Industry, Factor, Energy, Metals, Currencies, and more): which corners of the markets are beating benchmarks, which ones are overlooked and which ones are over-crowded
Key Econ Events and Earnings On-Deck For This Week

Market-On-Close
Market Overview: Volatility Amid Policy Uncertainty
The US equity markets experienced a choppy trading week characterized by low volumes and diminished liquidity as investors navigated a complex landscape of central bank decisions, policy uncertainties, and mixed corporate signals. Despite closing the week with modest gains on Friday, the broader sentiment remained cautious as market participants braced for President Trump's April 2 deadline for the next phase of reciprocal tariff announcements.
The S&P 500 managed to end in slightly positive territory after recovering from early losses on Friday, bolstered by a significant rally in the "Magnificent Seven" technology stocks that sparked short covering across the broader market. This late-week rebound helped major indices snap their multi-week declines, with the Dow Jones Industrial Average emerging as the week's top performer with a 1.2% advance. Meanwhile, the technology-heavy Nasdaq Composite lagged behind its peers as large-cap tech stocks generally underperformed.
All four major index ETFs remains under their 200-day SMA, reflecting investors' hesitancy amid concerns over potential supply chain disruptions, increased input costs, and implications for corporate profitability as new tariff policies take shape.
Federal Reserve: Steady Policy Amid Increasing Uncertainty
The Federal Open Market Committee (FOMC) concluded its March meeting as expected, maintaining its target range for the federal funds rate at 4.25%-4.5% for the second consecutive meeting. The committee's decision reflects a more patient approach toward easing monetary policy amid slowing economic growth and heightened policy uncertainty.
Fed Chair Jerome Powell's comments struck a cautiously optimistic tone, noting that while uncertainty had increased, the Fed's "base case" scenario considers the impact of tariffs to be transitory. The Fed maintained its projection of two rate cuts in 2025, despite raising inflation expectations to 2.7% for the year (up from 2.5% previously) and lowering economic growth forecasts to 1.7% (down from 2.1% in December).

In a significant policy adjustment, the Fed announced plans to slow its balance sheet reduction program, known as quantitative tightening (QT). Starting in April, holdings of U.S. Treasury securities will be reduced by $5 billion per month, down from the current $25 billion, while holdings of U.S. government agency debt and mortgage-backed securities will continue to decline by up to $35 billion monthly. This calibrated slowdown in QT effectively represents a modest easing of monetary conditions, as the Fed will increase its participation in Treasury bond auctions, potentially helping to contain upward pressure on bond yields.
Markets are currently pricing in approximately 70 basis points of rate cuts by year-end, with only a 21% probability of a 25 basis point cut at the May 6-7 FOMC meeting. The current federal funds rate of approximately 4.35%, compared to PCE inflation at 2.5%, indicates monetary policy remains restrictive, with rates well above the neutral level typically considered to be around 1% above the inflation rate.
Fixed Income Markets: Yields Edge Higher on Fed Hawkishness
Treasury markets experienced modest pressure on Friday as yields edged slightly higher following hawkish comments from Federal Reserve officials. New York Fed President Williams characterized the current "modestly restrictive stance" as "entirely appropriate" given the solid labor market and inflation still running above the Fed's 2% target. Similarly, Chicago Fed President Goolsbee signaled support for steady policy, citing strength in economic data and the need for the Fed to maintain a steady hand.
The 10-year Treasury yield rose 0.9 basis points to 4.246% on Friday, as June T-notes relinquished early gains to close down 2.5 ticks. Earlier strength in T-notes had been supported by weakness in equity markets and positive momentum in 10-year German bunds, which provided some carryover support.

European bond yields presented a mixed picture, with the 10-year German bund yield falling 1.5 basis points to 2.765%, while the 10-year UK gilt yield increased 6.7 basis points to 4.712%. The Eurozone March consumer confidence index unexpectedly declined by 0.9 to -14.5, falling short of expectations for an improvement to -13.0.
In contrast to the Federal Reserve's steady stance, the European Central Bank appears poised for monetary easing, with ECB Governing Council member Stournaras indicating that "everything points in the direction of an ECB rate cut in April." Swaps are currently discounting a 59% probability of a 25 basis point rate cut at the ECB's April 17 policy meeting.
Corporate Earnings: Mixed Signals from Key Economic Barometers
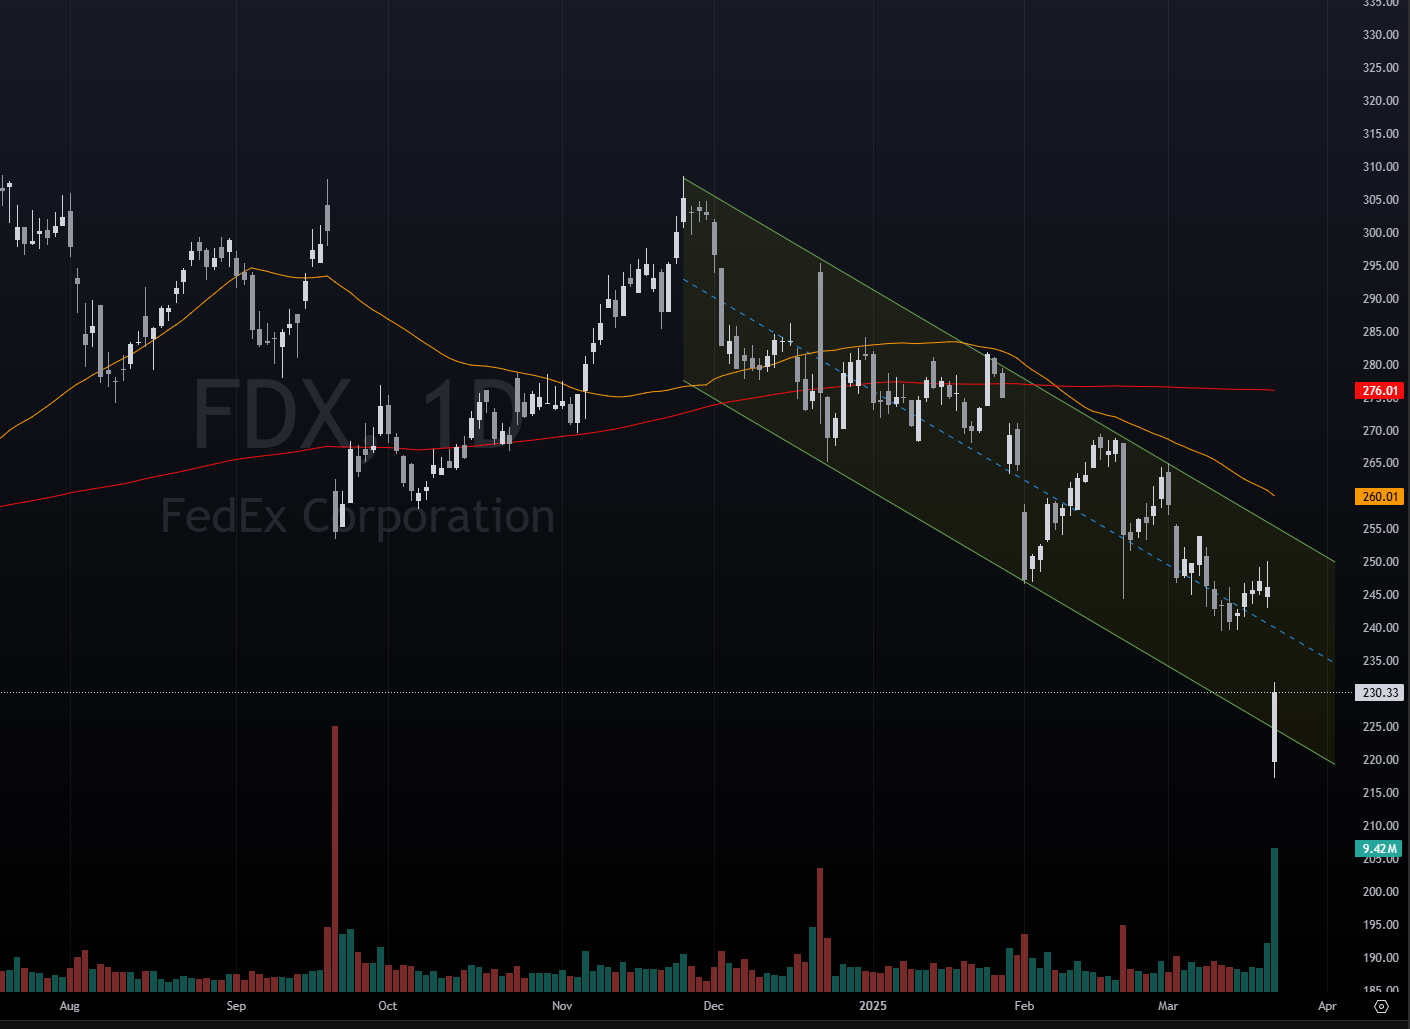
Corporate earnings reports sent mixed signals about the health of the economy and raised concerns about the potential impact of tariffs on future profitability. FedEx, widely considered an economic barometer, closed down more than 6% after cutting its profit outlook for the third consecutive quarter, citing cost pressures and weakening demand. The company reduced its full-year adjusted EPS forecast to $18.00-$18.60 from a previous estimate of $19.00-$20.00, falling short of the consensus expectation of $18.95.
The semiconductor sector faced significant pressure as Micron Technology closed down more than 8% after forecasting third-quarter adjusted gross margins below consensus estimates. This weakness spread throughout the chip sector, affecting companies like Lam Research, ASML Holding, Applied Materials, KLA Corp, Nvidia, and NXP Semiconductors, all of which closed lower by at least 1%.
Nike provided another source of concern, closing down more than 5% after warning of double-digit declines in digital traffic in fiscal 2026 and elevated inventory levels across categories. The company specifically cited tariffs on products from China and Mexico as contributing factors to its challenges.
Homebuilders also faced headwinds, with Lennar Corp declining more than 4% after reporting first-quarter home sales gross margins of 18.7% versus 21.8% year-over-year and forecasting second-quarter new orders below consensus expectations. This weakness extended to peers like PulteGroup, DR Horton, and Toll Brothers.
On a more positive note, Alnylam Pharmaceuticals surged more than 11% after winning expanded approval for its heart drug, Amvuttra, to treat transthyretin amyloid cardiomyopathy. Super Micro Computer climbed more than 7% following an upgrade from JPMorgan Chase, while Boeing advanced more than 3% after being selected by the US government to build the next-generation US fighter jet, edging out rival Lockheed Martin, which subsequently fell more than 4%.
Economic Data: Signs of Cooling from Above-Trend Pace
Recent economic indicators suggest the US economy is moderating from its above-trend pace, though not to levels indicating an imminent recession. The Conference Board's Leading Economic Index (LEI) continued its downward trend, falling 0.3% to 101.1 in February, primarily driven by weaker consumer expectations for business conditions and lower manufacturing new orders. However, the index's six-month change, while still negative, maintained its upward trajectory, suggesting that a recession is not imminent.
Labor market conditions remained generally favorable, with initial jobless claims rising to 223,000, slightly below estimates of 224,000. Claims have averaged about 227,000 over the past four weeks, modestly above the weekly average of 223,000 for 2024. While federal government layoffs may drive claims higher in the coming months, the underlying labor market remains healthy with the unemployment rate at 4.1% and job openings exceeding unemployment, supporting positive real wage growth.

The manufacturing sector showed surprising strength, with industrial production rising 0.7% in February, exceeding expectations for a 0.3% increase and reaching its highest level on record. Manufacturing output, which represents the majority of industrial production, increased by 0.9%, outpacing forecasts for a 0.3% rise and benefiting significantly from a surge in automotive output. This stronger-than-expected performance may partially reflect businesses accelerating purchases of inputs ahead of potential tariffs, suggesting the pace may not be sustainable.
Retail sales data painted a more subdued picture, with February sales rising just 0.2%, well below consensus estimates for a 0.7% increase. January's reading was also revised down to -1.2%, marking the steepest decline since July 2021. However, control group sales—which feed directly into the GDP calculation and exclude several volatile categories—rose 1% during the month, exceeding estimates for a 0.4% gain.
The housing market showed signs of improvement, with existing home sales increasing 4.2% in February, driven by improved supply conditions. February housing starts also surprised to the upside with an adjusted annual rate of 1.5 million starts, up 11.2% from January, although this represented a 2.9% year-over-year decline.
Sector Performance: Value Outpaces Growth
Value stocks continued their recent outperformance relative to growth counterparts, marking the fifth consecutive week of superior returns. As measured by the Russell 1000 indices, value has now outperformed growth by 897 basis points (8.97 percentage points) year-to-date, reflecting a significant rotation in market leadership.
The rebound of the Magnificent Seven stocks on Friday helped facilitate the broader market recovery. Tesla led gainers in the Nasdaq 100 with a more than 5% increase, while Apple, Meta Platforms, and Microsoft all gained more than 1%. Alphabet and Amazon.com also closed in positive territory, rising 0.73% and 0.65% respectively.
Within the broader market, industrials received a boost from Boeing's selection as the builder of the next-generation US fighter jet, while the healthcare sector benefited from Alnylam Pharmaceuticals' regulatory win. Consumer discretionary stocks faced pressure from Nike's disappointing outlook, and semiconductors broadly declined following Micron's underwhelming guidance.
International Markets: Diversification Benefits Emerge
International markets have emerged as a source of portfolio diversification benefits as US stocks experienced their recent pullback. International stocks have generated the strongest returns among major asset classes year-to-date, led by developed-market large-cap stocks. European markets, in particular, have benefited from expectations of a multi-year plan to increase defense and infrastructure spending, which could help stimulate growth in a region that has experienced economic stagnation in recent years.

Chinese stocks have also rallied on anticipation of additional fiscal and monetary stimulus measures aimed at boosting consumption and addressing deflation concerns. The weakening of the US dollar from its January peak has further enhanced returns for investments denominated in major international currencies.
Despite these positive catalysts, global markets closed lower on Friday. The Euro Stoxx 50 declined 0.50%, China's Shanghai Composite Index fell to a one-week low, closing down 1.29%, and Japan's Nikkei Stock 225 finished down 0.20%.
Fixed Income Performance: Solid Returns Amid Rate Expectations
US bond markets have produced robust returns in recent months, buoyed by expectations for Federal Reserve interest rate cuts and forecasts for slower economic growth. US investment-grade bonds, which form the foundation of fixed-income portfolios, have delivered among the strongest returns within the fixed-income universe.

Emerging market debt has been the top performer in fixed income, extending last year's strong returns and highlighting the value of diversifying bond allocations beyond US securities. The favorable performance of fixed-income assets has provided an important counterbalance to equity market volatility, reinforcing the benefits of maintaining well-diversified portfolios.
Geopolitical Risks: Middle East Tensions Persist
Heightened geopolitical risks in the Middle East continued to weigh on market sentiment. Israel launched a series of airstrikes across Gaza, ending a two-month ceasefire with Hamas, as Israeli Prime Minister Netanyahu pledged to act "with increasing military strength" to free hostages and disarm Hamas.
Concurrently, the US maintained its campaign of strikes against Yemen's Houthi rebels, with US Defense Secretary Hegseth characterizing the strikes as "unrelenting" until the group ceases attacks on vessels in the Red Sea. The Houthi rebels have threatened to respond by targeting US vessels in the region, raising concerns about potential disruptions to global shipping routes.
These persistent geopolitical tensions, combined with uncertainty surrounding US trade policy, have contributed to increased demand for safe-haven assets, with gold trading near record highs at $3,012 per ounce, representing a 13.3% gain year-to-date.
Market Technical Factors: Triple Witching and Pension Rebalancing
Market volatility was heightened on Friday due to the quarterly "triple witching" expiration of nearly $4.5 trillion of March options and futures contracts tied to stocks, indexes, and exchange-traded funds. This event typically creates the potential for sudden price movements as contracts expire and traders roll over existing positions.
Looking ahead, several technical factors could influence market direction in the near term. Systematic trading strategies have reached maximum short positions, potentially setting the stage for a reversal if market conditions improve. Additionally, pension funds are projected to purchase approximately $29 billion of equities during their quarterly rebalancing period, representing a historically high level of potential buying pressure.
Trade Policy Concerns: Tariff Implementation Timeline Approaches
Market participants remain focused on President Trump's April 2 deadline for implementing a series of broad reciprocal tariffs on foreign nations. These trade policy concerns have pressured stocks over the past two weeks, with investors expressing apprehension about the potential negative impact on economic growth and corporate earnings.
The administration has already implemented significant tariff increases, imposing 25% tariffs on Canadian and Mexican goods and doubling the tariff rate on Chinese goods to 20% from 10% on March 4. President Trump recently reiterated his intention to impose reciprocal tariffs and additional sector-specific tariffs on April 2, maintaining pressure on markets as this deadline approaches.
Looking Ahead: Growth Outlook and Policy Impact
Despite the various challenges facing financial markets, expectations persist for an acceleration in economic growth later in the year, supported by anticipated lower interest rates and pro-growth policies such as deregulation and tax cuts. The Fed's measured approach to monetary policy, combined with its plans to slow the pace of quantitative tightening, should help provide a more supportive backdrop for both the economy and markets as 2025 progresses.
However, the implementation and potential impact of tariffs remain significant sources of uncertainty that could influence both economic growth trajectories and inflation dynamics. The Fed has acknowledged these uncertainties in its projections, lowering its growth forecast while raising its inflation expectations, suggesting it anticipates tariffs will slow economic growth while triggering a one-time adjustment in prices that leads to a short-term increase in inflation.
As these policy developments unfold in the coming weeks, market participants will be closely monitoring their implications for global supply chains, input costs, and overall corporate profitability. The market's reaction to these developments will likely determine whether the recent technical signals suggesting potential upside can materialize into a more sustained market recovery.
5-Day Futures Performance Leaders

Equity Futures (S&P 500, Dow Jones, Nasdaq):
Market Recovery: After a period of volatility, U.S. stock markets showed resilience. The S&P 500 and Nasdaq both snapped four-week losing streaks, with the S&P 500 rising by 0.5% and the Nasdaq by 0.2% for the week. The Dow Jones Industrial Average also posted a weekly gain of 1.2%.
Earnings Reports: Corporate earnings had a notable impact on equity futures. FedEx ( FDX 0.00%↑ ) shares declined by 6.5% after reporting weaker-than-expected fiscal third-quarter earnings and lowering its full-year guidance due to ongoing industrial economic challenges. Nike ( NKE 0.00%↑ ) shares fell 5.5% following a forecasted decrease in sales for the current quarter. Additionally, Micron Technology's ( MU 0.00%↑ ) stock dropped 8% despite exceeding earnings expectations, as investors expressed concerns over future demand.
Commodity Futures (Oil, Gold):
Oil Prices: Oil futures experienced gains this week amid a complex backdrop of geopolitical tensions and economic factors. New U.S. sanctions on Iran and issues in the Middle East supported price increases. However, fears of a global recession and increasing output from OPEC+ exerted downward pressure. Consequently, oil prices fluctuated but managed to score a weekly rise.
Gold Prices: Gold futures surged, briefly surpassing the $3,000 per ounce mark for the first time ever. This increase was driven by investors seeking safe-haven assets amid economic uncertainties and market volatility.
Currency Futures (U.S. Dollar):
Dollar Weakness: The U.S. dollar faced a 4.4% year-to-date decline, challenging expectations of its continued rise post-election. This depreciation influenced currency futures and reflected shifting investor sentiment.
S&P 500 Sector Insights

Technology Sector
Mixed Performance: Microsoft ( MSFT 0.00%↑ ) and Apple ( AAPL 0.00%↑ ) posted gains, while Nvidia ( NVDA 0.00%↑ ) and Broadcom ( AVGO 0.00%↑ ) saw notable losses.
Key News:
Nvidia (NVDA -3.26%) Decline: The drop in Nvidia follows a recent pullback in AI-related stocks, profit-taking, and concerns about China’s semiconductor restrictions impacting demand.
Microsoft (MSFT +0.69%) & Apple (AAPL +2.24%) Gains:
Microsoft is benefitting from its continued AI expansion with OpenAI.
Apple surged as investors anticipate a revival in iPhone sales, particularly in China, after recent setbacks.
Semiconductors
Overall Weakness: Nvidia (NVDA), Broadcom (AVGO), Micron (MU), and Advanced Micro Devices (AMD) saw divergent performance.
Key News:
Micron (MU -6.02%) Dropped Sharply: Despite beating earnings expectations, the company issued a cautious forward outlook that impacted the semiconductor sector.
AMD (AMD +5.42%) Gains: AMD continues to benefit from its AI chip momentum, driven by expectations of strong server demand.
Financials
Strong Performance: JPMorgan ( JPM 0.00%↑ +3.95%), Goldman Sachs ( GS 0.00%↑ +4.38%), and Bank of America ( BAC 0.00%↑ +3.86%) led gains.
Key News:
Banks surged after Fed signals fewer rate cuts than expected, reinforcing higher-for-longer interest rates, which benefit banking profits.
Communication Services
Weak Performance: Google ( GOOG 0.00%↑ -0.82%) and Meta ( META 0.00%↑ -1.87%) were down.
Key News:
Meta is facing headwinds driven by EU regulations on data privacy that could impact advertising revenue.
Industrials
Mixed Performance: Boeing ( BA 0.00%↑ +10.07%) soared, while Lockheed Martin ( LMT 0.00%↑ -5.65%) slumped.
Key News:
Boeing’s Surge: Driven by new aircraft orders from Japan Airlines and improved analyst expectations.
Lockheed Martin’s Drop: Tied to budget concerns surrounding defense spending and project delays.
Energy
Strong Performance: ExxonMobil ( XOM 0.00%↑ +3.22%) and Chevron ( CVX 0.00%↑ +4.92%) were among top gainers.
Key News:
Oil Prices Surged amid Middle East tensions and U.S. sanctions on Iran, fueling oil and gas stock gains.
Consumer Discretionary
Weak Performance: Amazon ( AMZN 0.00%↑ -0.88%) and Tesla ( TSLA 0.00%↑ -0.51%) saw declines.
Key News:
Tesla’s Decline: Amid China EV competition concerns, as BYD continues to dominate in affordability.
Nike (NKE -5.19%) Slid: Lowered sales expectations due to weak consumer demand in China.
Final Takeaways:
Tech & Semiconductors struggled due to AI sector pullbacks, regulatory concerns, and Micron’s outlook.
Financials surged as the Fed maintained a higher-for-longer rate stance.
Energy spiked as oil prices rose on geopolitical risks.
Industrials were mixed, with Boeing soaring but defense stocks slipping.
Consumer Discretionary underperformed, hit by China demand concerns.
5-Day Sector Leaderboard
5-Day Individual Performance Grouped By Sector (Size By Market Cap)

ETF Insights
Reviewing a heatmap like this weekly can be incredibly helpful for investors as it provides a quick and visual summary of market performance across various sectors, asset classes, and geographies.
1. Sector and Asset Class Trends
Identify Strong and Weak Sectors: Investors can quickly spot which sectors (e.g., technology, energy, healthcare) are performing well or underperforming.
Asset Class Diversification: Seeing how commodities, fixed income, equities, and cryptocurrencies performed helps assess diversification.
2. Market Sentiment
Risk-On or Risk-Off: A green-dominated map suggests bullish sentiment, while red indicates bearish sentiment. Investors can align their strategies accordingly.
Volatility Indicators: Observing movements in volatility indices (e.g., VIX) can highlight changing market dynamics.
3. Regional Analysis
Global Insights: Performance in developed and emerging markets (e.g., Europe, China, Asia-Pacific) helps in gauging international investment opportunities or risks.
Currency Impacts: Movements in forex or country-specific ETFs can indicate currency-driven market trends.
4. Thematic Trends
Growth vs. Value: Comparing the performance of growth ETFs (e.g., VUG) versus value ETFs (e.g., VTV) reveals the prevailing market preference.
Industry Leadership: Highlighting leadership within industries (e.g., gold miners, semiconductors) can inform thematic plays.
5. Monitoring Investments
Portfolio Alignment: Investors can track how their existing investments or watchlist align with broader market trends.
Rotation Signals: Seeing week-over-week changes in sector dominance may signal sector rotation opportunities.
6. Risk Management
Recognizing Overbought/Oversold Conditions: Consistent underperformance or overperformance in specific areas may indicate potential mean-reversion trades.
Correlation Awareness: By observing how different asset classes move, investors can manage portfolio correlation and risk.
7. Decision Support
Identify Outperformers/Underperformers: ETFs, sectors, or indices that repeatedly outperform or underperform can help refine trading or investment strategies.
Macro Perspective: Weekly trends highlight macroeconomic or geopolitical influences affecting markets.
Regularly reviewing a heatmap like this is a strategic practice that supports data-driven decision-making while fostering a holistic understanding of market dynamics.

1. Broad Market & U.S. Equities
Slightly Positive Bias:
The S&P 500 ETF (SPY +0.21%), Nasdaq-100 ETF (QQQ +0.25%), and Dow Jones ETF (DIA +1.03%) all showed moderate gains, indicating a resilient market performance despite mixed sector moves.
Russell 2000 ETFs (IWM +0.44%) and mid-cap ETFs (MDY +0.40%) also showed slight gains, suggesting broader participation in the rally beyond just large-cap tech.
Value vs. Growth:
Value ETFs (VTV +0.81%, IWD +0.55%) outperformed growth ETFs (VUG +0.54%, IWF +0.19%), indicating that investors may be rotating into more defensive, established names amid market uncertainty.
2. Sector Performance
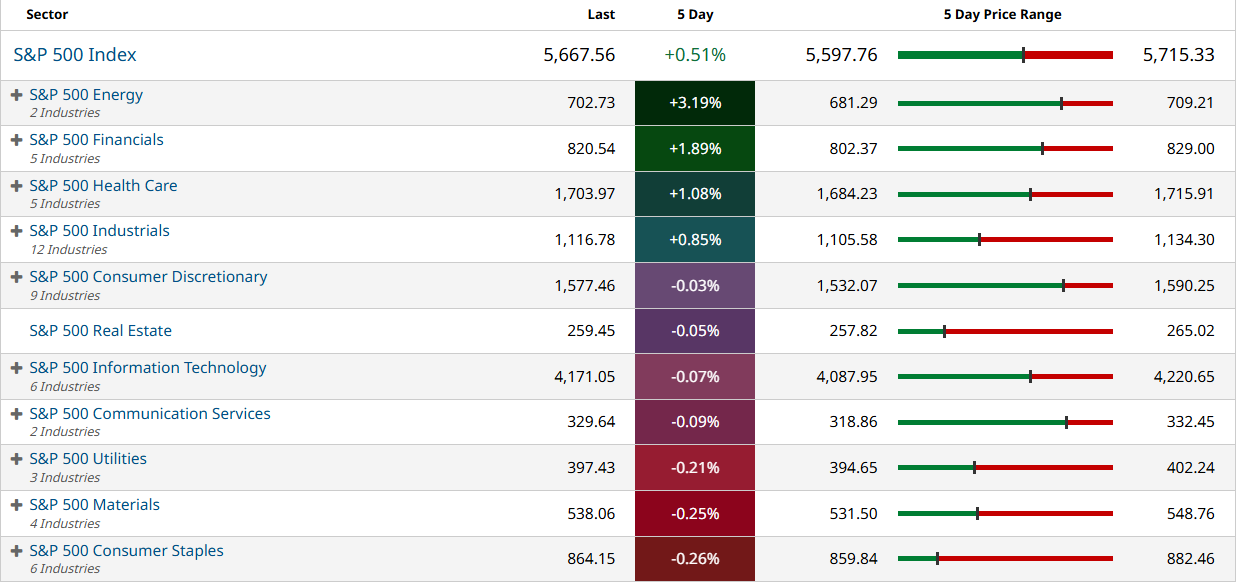
Winners:
Energy (XLE +3.08%, XOP +3.49%): Energy ETFs surged as oil and gas stocks rallied following geopolitical tensions and supply concerns.
Financials (XLF +1.94%): Financial stocks saw strong performance, likely due to higher interest rate expectations benefiting bank profit margins.
Losers:
Semiconductors & Tech (SMH -0.79%, SOXL -2.63%): Semiconductor stocks struggled, likely due to profit-taking and geopolitical risks affecting chipmakers.
Precious Metals & Miners (SLV -2.25%): Silver and other precious metals ETFs were among the worst performers, suggesting lower demand for safe-haven assets amid stable macroeconomic conditions.
3. Bonds & Fixed Income
Modest Gains Across Treasuries & Corporate Bonds:
Treasuries (TLT +0.59%, IEF +0.57%) and corporate bonds (LQD +0.75%, AGG +0.47%) saw slight positive moves, suggesting continued demand for income assets amid rate uncertainty.
Inflation-Protected Bonds (TIP +0.62%) also gained, indicating some expectations of inflationary pressures persisting.
4. Global Markets
Mixed Performance Across Regions:
China ETFs (FXI -2.92%, ASHR -4.26%, YINN -8.93%) were the biggest losers, reflecting concerns over China's economic slowdown, weak demand, and regulatory pressure.
India (INDA +1.53%) and Brazil (EWZ +2.83%) outperformed, suggesting emerging market strength outside of China.
European ETFs (EZU -0.48%, VGK -0.94%) were slightly lower, potentially due to growth concerns and ECB policy uncertainty.
5. Volatility & Leverage ETFs
Volatility Crushed:
VIX-related ETFs (UVXY -9.37%, VXX -6.66%) plummeted, showing that market fears have subsided, leading to lower demand for hedging instruments.
Leverage ETF Performance:
Bullish leveraged ETFs (TQQQ +0.47%, SPXL +0.45%) were positive, showing investors are still comfortable taking risk.
Inverse ETFs (SPXS -1.54%, SQQQ -0.90%) fell, further confirming that market sentiment was starting to assume a broadly risk-on stance.
Final Takeaways
Market Sentiment: Slightly Bullish with a risk-on bias.
Sector Strength: Energy & Financials led gains, while Tech & Semiconductors lagged.
Treasuries & Bonds: Positive but not aggressively bought, indicating stable rate expectations.
Global Markets: China ETFs were notably weak, while India and Brazil showed resilience.
Volatility Plummeted, indicating investors are not overly concerned about near-term risks.
Global Overview
Foreign ADR stocks listed on NYSE, NASDAQ & AMEX categorized by geographic location. Reviewing a global heatmap like this weekly is valuable for investors because it offers insights into international markets, helping to:
Identify Global Trends: Spot which regions or countries are performing well or underperforming.
Assess Sector and Regional Performance: Understand how industries are faring across different regions.
Diversify Portfolios: Uncover opportunities in emerging or developed markets for greater diversification.
Gauge Global Sentiment: Recognize the impact of macroeconomic events on specific regions.
Align with Global Strategies: Refine investment strategies based on regional strengths or weaknesses.
This overview ensures investors stay informed about global opportunities and risks, complementing their domestic market analysis.

1. North America (Canada)
Positive Performance Overall
Biggest Gainers:
Royal Bank of Canada (RY +1.89%) and Bank of Montreal (BMO +2.06%) benefited from higher banking sector optimism amid rate stability.
Shopify (SHOP +9.87%) surged following strong earnings and improved growth outlook.
Decliners:
Canadian Pacific (CP -4.42%) was hit by weaker-than-expected freight demand.
2. Europe
Mixed Performance Across the Region:
United Kingdom:
Energy Stocks Like Shell (SHEL +3.26%) and BP (BP +3.47%) rallied due to higher oil prices following new U.S. sanctions on Iran and OPEC+ discussions.
Accenture (ACN -4.23%) dropped on a weaker-than-expected revenue forecast.
Germany & France:
SAP (SAP +3.28%) gained following positive AI-driven cloud growth expectations.
Sanofi (SNY -1.47%) fell due to regulatory concerns over drug pricing.
Netherlands & Switzerland:
ASML (ASML +0.31%) held steady despite ongoing concerns over U.S. semiconductor restrictions on China.
3. Asia-Pacific
China Underperformed, Taiwan & Japan Outperformed
China ADRs (Alibaba BABA -4.22%, NetEase NTES -5.59%) fell sharply amid continued regulatory pressure and weaker economic data.
Pinduoduo (PDD +3.35%) was an exception, likely benefiting from continued consumer resilience in lower-tier Chinese cities.
Taiwan Semiconductor (TSM +1.52%) continued higher on robust AI chip demand.
Japan Outperformed:
Mitsubishi UFJ (MUFG +9.66%) and Sony (SONY +4.69%) surged on strong financial sector gains and AI-driven optimism in entertainment.
4. Latin America
Strong Performance in Brazil
Petrobras (PBR +5.44%) and Vale (VALE +2.66%) rose as commodity prices remained resilient.
Bradesco (BBD +4.13%) and other banks also gained due to stable Brazilian central bank rate guidance.
Argentina & Mexico Weaker
Banco Macro (BMA -4.77%) struggled, possibly due to economic instability concerns.
América Móvil (AMX -1.81%) in Mexico slipped as telecom growth in Latin America remained sluggish.
5. Africa & Australia
South African Gold Miners Rallied
Gold Fields (GFI +7.09%) and Harmony Gold (HMY +5.12%) surged as gold prices hit new highs amid economic uncertainty.
Australia Mixed
BHP (BHP -0.61%) saw a slight decline, possibly due to weaker Chinese demand for raw materials.
Final Takeaways:
Winners:
Brazil, Japan, South African gold miners, and Taiwan ADRs performed well.
Shopify and Canadian banks saw strong gains.
Energy stocks (Shell, BP, Petrobras) benefited from rising oil prices.
Losers:
China ADRs struggled significantly due to economic weakness & regulatory issues.
European industrials and U.K. stocks were mixed, with Accenture leading losses.
Argentina & Mexican financials also saw declines.

🔥 BIG MONEY MOVES: Insider Look at This Week's Top Institutional Trades
Smart Money's Latest Positions Revealed
Our exclusive institutional trading data has just been updated with thousands of new datapoints…the most significant trades this week represent over $334 billion in capital movement. These aren't retail trades—these are the calculated positions of the world's most sophisticated investors expressing their market thesis through substantial capital deployment, both long and short.
💰 The Mega Moves: Billions in Motion
DoorDash ( DASH 0.00%↑ ) registered a staggering $7.36 billion institutional position with a #1 rank—the single largest high-conviction trade in our dataset from this week. This massive capital commitment comes as DASH is slated to be one of several new tickers joining the S&P 500.
Healthcare Giants Under Scrutiny: Merck ( MRK 0.00%↑ ) and Pfizer ( PFE 0.00%↑ ) saw massive #1 ranked institutional positions worth $4.29 billion and $3.85 billion respectively, signaling major institutional players taking significant positions ahead of pipeline developments and drug pricing policy shifts.
Energy Sector Polarization: ConocoPhillips ( COP 0.00%↑ ) and Expro Group ( EXE 0.00%↑ ) both received top-ranked institutional positions exceeding $2.9 billion each, reflecting strong opposing views on energy market dynamics and fossil fuel demand forecasts.
🚀 Industry Positioning: Where Smart Money Is Taking Sides
Institutional capital is making significant moves across sectors, revealing major investment battlegrounds where bulls and bears are placing substantial bets:
Pharma's High-Stakes Game: Pharmaceutical trading saw an extraordinary $18.1 billion across just 21 trades, averaging $859.6 million per position—the highest concentration in the dataset. Merck and Pfizer's #1 ranked multi-billion-dollar positions suggest institutions taking definitive stances on upcoming pipeline catalysts.
Food Industry's Divergent Viewpoints: The Food Products industry showed exceptional institutional activity with 22.58% of its trades having top rank status and over $8.3 billion in capital flow. This concentrated positioning suggests smart money taking strong positions—both long and short—amid inflation concerns and changing consumer behaviors.
Banking Sector's Contested Future: The banking industry saw 119 institutional trades worth $15.1 billion with 14 top-ranked positions, including USB's massive $2.15 billion #1 ranked trade. This battleground reflects divergent views on interest rates, regulatory changes, and financial sector health.
Semiconductor Stakes Intensify: The semiconductor industry led all sectors with $22.1 billion in institutional positioning across 47 trades, reflecting major bets on both sides regarding AI expansion, computing infrastructure, and chip demand cycles.
📊 Sector Intelligence: Following the Money Flow
Technology Capital Concentration: The tech sector attracted a commanding $70.2 billion in institutional positioning—59% more than any other sector—with semiconductor stocks leading at $22.1 billion. NVIDIA ($4.5B) and Broadcom ($6.3B across multiple trades) show particularly strong institutional interest, representing significant conviction on both sides of the AI and chip demand debate.
Financial Services Division Lines: Financial institutions were the focus of $44.1 billion in institutional capital with 29 top-ranked trades, revealing sharp disagreement on sector prospects amid changing interest rate expectations and regulatory environments.
Consumer Discretionary Battleground: Despite broader retail concerns, this sector saw $36.3 billion in institutional positioning, highlighted by Williams-Sonoma's massive position and Target's (TGT) $2 billion #1 ranked trade. These trades reflect opposing institutional views on consumer spending resilience and retail winners versus losers.
💎 Hidden Gems: Top-Ranked Smaller Positions
While mega-cap positions dominate headlines, these smaller top-ranked trades may signal institutional conviction worth noting:
Playa Hotels & Resorts ( PLYA 0.00%↑ ): This hospitality player attracted a #1 ranked $94.5 million institutional position, potentially signaling a decisive stance on travel sector prospects—bullish anticipation of continued recovery or bearish concerns about overvaluation.
Sony Group ( SONY 0.00%↑ ): The Japanese tech giant saw a #1 ranked $85.8 million trade alongside 7 total institutional positions, reflecting institutional opinions on its gaming, entertainment, and technology segments amid shifting competitive landscapes.
Buckle ( BKE 0.00%↑ ): This specialty retailer drew a #1 ranked $82.9 million position despite broader retail sector challenges, suggesting a strong institutional perspective on its differentiated business model and valuation.
Select Energy Services ( WTTR 0.00%↑ ): This energy services provider received a #1 ranked $83.8 million position, representing institutional conviction regarding the outlook for North American oil and gas field services.
🧠 The Bottom Line
Institutional money is making decisive and concentrated moves that signals strong convictions across sectors. A remarkable 1,681 of highly ranked institutional trades worth over $304 billion occurred on March 21st alone—suggesting portfolio managers are aggressively taking positions ahead of anticipated market developments.
This unusual concentration of activity indicates sophisticated investors with strong opinions about upcoming catalysts. By understanding where and how institutions are positioning capital—both long and short—investors can identify sectors and stocks likely to experience significant price action in the coming weeks.
Dive into our complete dataset to see all institutional trades and position yourself ahead of Wall Street's next big moves.