


Market Momentum: Your Weekly Financial Forecast & Market Prep
Issue 39 / What to expect March 31, 2025 thru April 04, 2025
In This Issue
Market-On-Close: All of last week’s market-moving news and macro context in under 5 minutes + futures-at-a-glance
The Latest Investor Sentiment Readings
Institutional Support & Resistance Levels For Major Indices: Exactly where to look for support and resistance this week in SPY, QQQ, IWM & DIA
Institutional Activity By Sector: Institutional order flow by sector including the top institutionally-backed names in those sectors. We break it all down and provide the key insights and take-aways you need to navigate institutional positioning this week.
Top Institutional Order Flow In Individual Names: All of the largest sweeps and blocks on lit exchanges and hidden dark pools
Investments In Focus: Bull vs Bear arguments for AIG, EBAY, TXRH
Top Institutionally-Backed Gainers & Losers: An explosive watchlist for day traders seeking high-volatility
Normalized Performance By Thematics YTD (Sector, Industry, Factor, Energy, Metals, Currencies, and more): which corners of the markets are beating benchmarks, which ones are overlooked and which ones are over-crowded
Key Econ Events and Earnings On-Deck For This Week

Market-On-Close
Market Performance and Technical Indicators
The equity markets closed out the week with significant downside pressure, consolidating a pattern of distribution that's been developing throughout March. Friday's session registered decisive negative momentum across all major indices, with the S&P 500 dropping 1.97%, the Dow Jones Industrials shedding 1.69%, and the Nasdaq 100 experiencing the most acute selling pressure at 2.61%. This price action pushed the S&P 500 and Nasdaq 100 to breach their respective two-week support levels, while the Dow retraced to test its one-week support zone. The futures market is continuing to telegraph weakness, with June E-mini S&P futures contracting 2.18% and June E-mini Nasdaq futures exhibiting even greater relative weakness at 2.89%.
The technical damage to the market's structure is becoming increasingly pronounced. We're now seeing the fifth negative weekly candle in six weeks for the S&P 500, creating a clear downtrend in the intermediate timeframe. Volume analysis confirms this deteriorating market health, with Bank of America's examination of EPFR Global data revealing $20.3 billion in U.S. equity outflows for the week ending March 26 – the largest weekly capital exodus this year. This magnitude of fund outflow typically signals a significant repositioning by institutional participants rather than mere tactical adjustments.
Perhaps the most telling technical development is the pronounced rotation away from last year's market leadership. The growth-to-value ratio has inverted dramatically, with large-cap growth underperforming value by triple-digit basis points for the week. The growth index declined approximately 2.6% while value stocks demonstrated relative strength, limiting losses to just 0.4%. Year-to-date performance divergence has reached extreme levels, with the growth index down 10.0% against value's positive 1.2% return. This rotation often indicates a secular shift in market dynamics rather than a temporary adjustment.
Tariff Implementation: Structural Market Catalyst
The primary catalyst driving risk repricing has been the administration's increasingly defined tariff architecture. The implementation timeline began with the March 4 announcement imposing 25% tariffs on Canadian and Mexican imports alongside the doubling of Chinese tariffs to 20%. This was followed by the March 8 signal of reciprocal and sector-specific tariff implementation effective April 2.
The framework's scope expanded significantly with Wednesday's executive action implementing a 25% tariff on all U.S. auto imports effective April 3, initially targeting fully assembled vehicles and expanding to component parts by May 3. The administration's characterization of these measures as "permanent" with no negotiating parameters has forced market participants to price in structural rather than transitory trade friction.

From a sectoral perspective, the automotive vertical faces substantial margin compression given approximately half of the 16 million units sold domestically last year originated from non-U.S. production facilities. The second-order effects will likely manifest in the used vehicle market, maintenance and repair costs, and insurance premiums. An interesting pairs trade has developed, with rental fleet operators experiencing share price appreciation as market participants anticipate enhanced residual values for their vehicle inventories.
The April 2 reciprocal tariff framework represents potentially the most significant trade policy recalibration in decades. The mechanism appears designed to match tariff levels on a country-by-country basis, with possible inclusion of non-tariff barriers such as VATs in the calculation. This graduated approach implies preferential treatment for nations maintaining minimal import barriers for U.S. goods, creating a more nuanced policy than universal tariff application. Additional sector-specific measures targeting lumber and pharmaceuticals are reportedly in advanced development.
The market's difficulty in efficiently pricing these policy shifts is evident in the Economic Policy Uncertainty Index, which has reached levels not seen since the initial COVID-19 dislocation. While the April 2 announcement will provide critical details regarding implementation methodology, the subsequent negotiation and potential retaliation dynamics will likely extend price discovery throughout Q2.

Large-Cap Technology: Momentum Reversal
Friday's session exposed significant technical weakness in the "Magnificent Seven" cohort that has dominated market returns throughout much of 2024. Amazon broke below key support levels with a 4%+ decline, while Alphabet and Meta similarly breached technical support with equivalent percentage losses. Tesla and Microsoft registered declines exceeding 3%, with Apple falling more than 2%. Even Nvidia, which had maintained relative strength in recent sessions, failed to hold support with a decline exceeding 1%.
The semiconductor ecosystem demonstrated even more acute weakness, with ON Semiconductor experiencing a 6%+ breakdown and NXP Semiconductors dropping more than 5%. Broader industry participation in the selloff was evident as Microchip Technology, KLA Corp, Marvell Technology, Intel, Analog Devices, Advanced Micro Devices, GlobalFoundries, Micron Technology, Lam Research, and Qualcomm all breached support levels with 3%+ declines.

This synchronized breakdown across the technology complex is particularly significant given these companies' disproportionate index weighting and historical role as market leaders. The sector's vulnerability stems from its exposure to global supply chain friction and international revenue streams that could face margin compression in a tariff-elevated environment. The magnitude of this correction cannot be understated, with the Magnificent Seven experiencing a 20% drawdown while the broader market has undergone a more standard correction. This separation in performance suggests a potential rotation rather than merely a temporary pullback.
Macroeconomic Cross-Currents: Stagflationary Signals
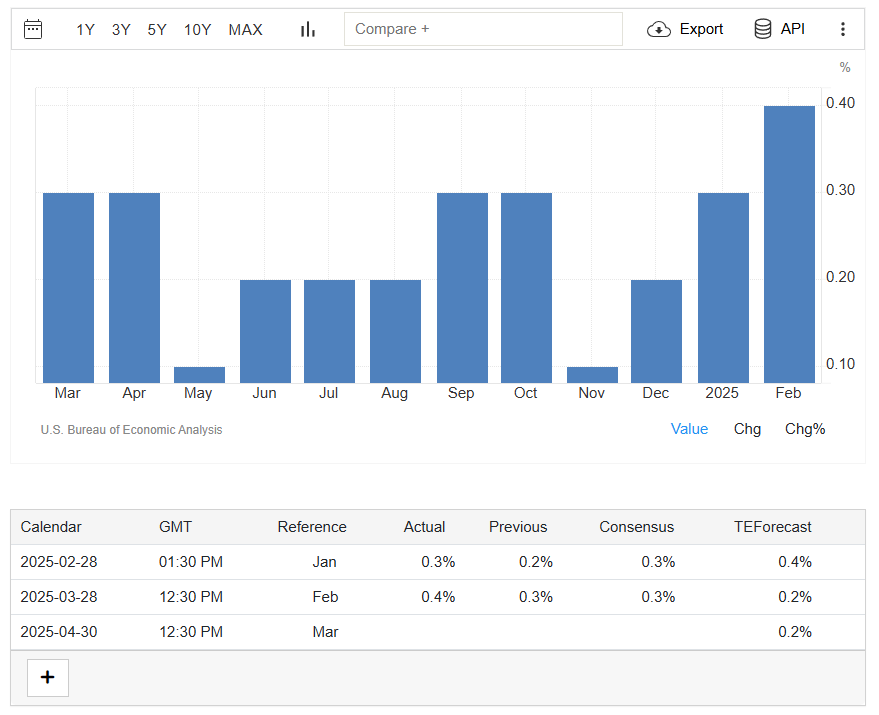
Friday's economic data release schedule presented a challenging narrative combination that exacerbated selling pressure. The February personal consumption report registered at 0.4% month-over-month, missing consensus expectations of 0.5% and suggesting demand deceleration. Conversely, personal income expanded 0.8% month-over-month, significantly outpacing the 0.4% consensus forecast and marking the largest monthly gain in 13 months.
The most consequential data point was the February core PCE price index – the Federal Reserve's preferred inflation gauge – which came in at 0.4% month-over-month and 2.8% year-over-year, exceeding consensus expectations of 0.3% and 2.7% respectively. This persistent inflation reading maintains significant distance from the Federal Reserve's 2.0% target, potentially constraining monetary policy flexibility.
Consumer sentiment metrics demonstrated material deterioration, with the University of Michigan's March index being revised downward to 57.0 – a 2-1/3 year low and well below the consensus expectation for no revision from the 57.9 preliminary reading. This represented a 12% month-over-month sentiment contraction, highlighting increasing consumer caution. The forward-looking expectations component registered an even more severe 18% decline, reflecting building anxiety about future economic conditions.

Perhaps most troubling from a monetary policy perspective was the inflation expectations component, with the March 1-year indicator rising to a 2-1/3 year high of 5.0% against expectations of 4.9%. The longer-term 5-10 year inflation expectations indicator reached a 32-year high of 4.1%, exceeding the 3.9% consensus forecast. This marked the third consecutive month with inflation expectations jumping at least 50 basis points, suggesting potential de-anchoring of price stability expectations.
The Conference Board's consumer confidence index demonstrated similar weakness, declining for the fourth consecutive month to 92.9 from February's 100.1 reading. The expectations component dropped 9.6 points to 65.2 – its lowest level in 12 years – and remained below the critical 80 threshold that historically signals recessionary conditions. The report specifically noted that future income optimism had "largely vanished," indicating consumer caution is transitioning from abstract concerns to concrete household financial planning.
Business Activity: Leading Sector Divergence
Business activity metrics display increasing sector bifurcation. S&P Global's Flash Composite PMI registered at 53.5 for March, indicating business expansion accelerating from February levels as service sector resilience offset manufacturing weakness. However, forward-looking indicators paint a more cautious picture, with business expectations for the next 12 months deteriorating to the second-lowest level since October 2022, with respondents specifically citing concerns about demand conditions and policy impacts.
The input price component exhibited the most rapid acceleration in nearly two years, primarily attributable to tariff implications and labor cost pressures. This leading price indicator suggests potential for consumer price pressures in coming quarters as businesses implement pass-through pricing strategies.
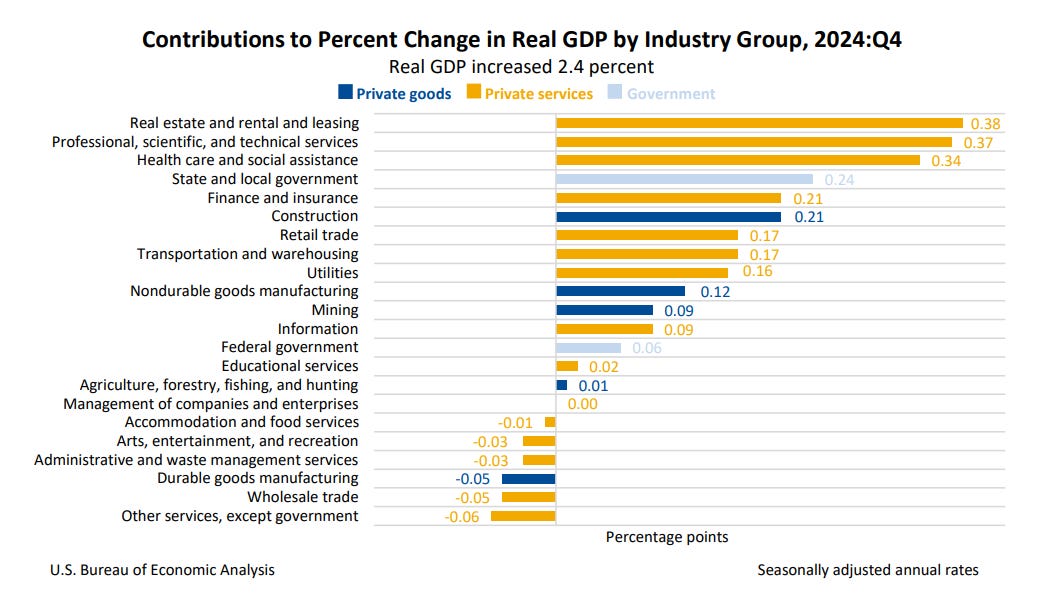
The broader growth trajectory shows Q4 2024 GDP at a 2.4% annualized rate, moderating from Q3's 3.1% pace but slightly exceeding initial estimates. The consensus expectation for Q1 2025 points to sub-2.0% growth when preliminary data is released on April 30, marking continued deceleration in the economic expansion.
Monetary Policy Positioning: Fed Communications Analysis
Federal Reserve communications reflect increasing internal debate regarding appropriate policy calibration. Boston Fed President Collins directly addressed the tariff impact, stating that it "inevitably" increases inflation pressure, at least in the near term. Richmond Fed President Barkin highlighted that rapid trade policy adjustments have created "a sense of instability" in the business community, with sentiment degradation potentially leading to demand contraction.
The most dovish perspective came from San Francisco Fed President Daly, who suggested a measured approach to assessing tariff impacts and maintained her projection for two 25 basis point rate reductions in 2025 as "reasonable." This divergence in FOMC member commentary indicates the complex balancing act required between inflation management and growth support.
Rate expectations have adjusted accordingly, with swaps markets now pricing two quarter-point reductions by year-end versus the three cuts projected earlier in Q1. Near-term easing expectations have been particularly impacted, with markets assigning just 21% probability to a 25 basis point cut at the May 6-7 FOMC meeting, effectively removing this meeting from consideration for policy adjustment.
Fixed Income Dynamics: Flight to Quality
The Treasury complex demonstrated classic flight-to-quality behavior, with June 10-year T-note futures advancing 25 ticks on Friday as the benchmark yield declined 9.9 basis points to 4.261%. This rally was supported by technical strength in 10-year German bunds, which reached three-week highs, and supply relief following the completion of Treasury auctions totaling $211 billion.
The yield curve response accelerated following the University of Michigan sentiment data release, with dovish comments from San Francisco Fed President Daly providing additional support for duration exposure.
European sovereign debt markets demonstrated similar technical patterns, with the 10-year German bund yield reaching a three-week low of 2.707% before closing down 4.6 basis points at 2.727%. UK gilts outperformed, with the 10-year yield compressing 8.9 basis points to 4.694%.
European economic indicators generally underperformed expectations, with the Eurozone March economic confidence index declining 1.1 to 95.2 versus consensus forecasts for improvement to 96.7. The German labor market showed particular weakness, with March unemployment increasing by 26,000 against expectations of 10,000. The unemployment rate rose 0.1 to a 4-1/2 year high of 6.3%, exceeding consensus expectations for stability at 6.2%.
Despite these contractionary signals, European inflation indicators remain elevated, with the ECB's February 1-year inflation expectations holding at 2.6%, above the 2.5% consensus forecast. Market pricing now assigns 85% probability to a 25 basis point rate cut by the ECB at its April 17 meeting, reflecting expectations for accommodation in response to growth deceleration.
Sector Rotation and Price Action Analysis
The recent market environment has produced significant performance dispersion across sectors, with defensive positioning increasingly favored. Friday's Treasury rally supported rate-sensitive utility stocks, with American Electric Power, CenterPoint Energy, Edison International, FirstEnergy, Eversource Energy, Ameren, and Public Service Enterprise Group all advancing more than 1%.
Cyclical and leisure-oriented equities experienced disproportionate pressure, with Delta Air Lines, Las Vegas Sands, Royal Caribbean Cruises, Wynn Resorts, Carnival, and United Airlines all dropping more than 4%. MGM Resorts International and Norwegian Cruise Line Holdings declined more than 3%, while Booking Holdings and Hilton Worldwide Holdings contracted more than 2%.
Individual equity movements of note included Lululemon Athletica, which experienced a 14%+ breakdown after providing forward revenue guidance of $11.15-11.30 billion for 2026, below the $11.31 billion consensus projection. Oxford Industries dropped more than 5% after issuing Q1, adjusted EPS guidance of $1.70-1.90, significantly below the $2.73 consensus expectation.

Positive outliers included WR Berkley, which rallied more than 7% to lead S&P 500 gainers after announcing Mitsui Sumitomo Insurance's agreement to acquire 15% of outstanding shares. AppLovin advanced more than 4% to lead Nasdaq 100 gainers following Loop Capital Markets' designation as a top pick with recommendation for "aggressive buying" on pullbacks.
The precious metals complex benefited from macro uncertainty, with AngloGold Ashanti gaining more than 2% as gold reached a new all-time high above $3,100 per ounce. The yellow metal closed Friday's session around $3,116, extending year-to-date appreciation to approximately 17% as investors sought safe-haven exposure during heightened economic and policy uncertainty.
Commodity Market Technical Analysis
Commodity markets have displayed significant technical divergence as macroeconomic and policy dynamics evolve. Gold has maintained its uptrend integrity with a fourth consecutive weekly gain, extending its year-to-date rally to 17%. The technical breakout above key resistance at $3,000 has accelerated momentum as the metal fulfills its traditional function during periods of elevated inflation and policy uncertainty.
The energy complex has underperformed amid demand concerns, with consensus Brent crude forecasts revised downward to $71 per barrel based on U.S. growth deceleration expectations and OPEC+'s decision to implement flexible production adjustments. The technical structure for crude oil remains negative, with key support levels vulnerable to further pressure.
Industrial metals have shown mixed technical patterns. Copper temporarily breached psychological resistance at $10,000 following tariff discussion reports before consolidating at $9,846.50. The base metals complex remains highly sensitive to both growth expectations and evolving trade policy frameworks.
International Market Correlation Analysis
U.S. trade policy developments have triggered synchronized risk-off responses across international markets. The Euro Stoxx 50 dropped to two-week support levels with a 0.92% decline, while China's Shanghai Composite contracted 0.67%. Japanese equities demonstrated particular weakness, with the Nikkei 225 falling to two-week support and closing down 1.80%.
European markets face disproportionate exposure to automotive tariff implications, with the sector representing 7% of the German DAX versus just 2% of the S&P 500. This structural difference explains the relative underperformance of European indices during recent sessions.
Emerging markets have displayed notable technical divergence, with certain markets significantly outperforming U.S. equities. China, Korea, and Brazil have generated double-digit returns, while India and Taiwan have registered negative performance. This dispersion likely reflects varying degrees of direct exposure to U.S. trade policy, with markets like India, which exports relatively little to the U.S., demonstrating resilience to tariff implications.
Technology Infrastructure: Capacity Utilization Concerns
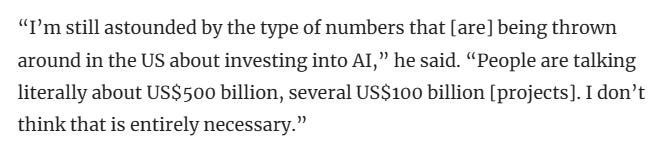
Beyond immediate trade policy considerations, the technology sector faces emerging capacity utilization challenges in AI infrastructure deployment. Alibaba Chairman Joe Tsai has identified potential speculative excess in datacenter expansion, noting that "people are investing ahead of the demand they are seeing today." This assessment gained credibility following reports that Microsoft has cancelled or deferred datacenter projects in the U.S. and Europe equivalent to approximately two gigawatts of electricity capacity, citing oversupply in AI computing clusters.

These developments raise fundamental questions regarding the sustainability of AI-driven capital expenditure that has supported technology valuations in recent quarters. The sector's 5.91% weekly decline suggests investors are recalibrating growth expectations for AI-related investments based on utilization rates rather than merely deployment metrics.
Forward Catalysts and Market Timing
Several high-impact catalysts will shape near-term market direction. President Trump's April 2 reciprocal tariff announcement will provide essential clarity regarding implementation methodology, scope, and timing. The market's reaction will depend on the extent to which countries receive exemptions or pursue retaliatory measures, determining the ultimate economic impact of these policies.
Friday's non-farm payroll report will confirm whether the moderation in jobs creation observed in early 2025 extended into March. February's 151,000 job additions represented marginal improvement from January's 125,000 but remained well below late-2024 levels. This data will provide critical insight into labor market resilience amid increasing uncertainty.
The initial Q1 2025 GDP estimate on April 30 will deliver comprehensive assessment of how the economy has responded to recent policy shifts and inflationary pressures. Consensus expectations for sub-2.0% growth would represent material deceleration from Q4's 2.4% expansion rate.
Portfolio Construction Implications
The current market environment requires tactical precision combined with strategic positioning. Core economic fundamentals remain constructive despite recent volatility, suggesting trade developments may not trigger recessionary conditions. Corporate profit trajectories continue to point to full-year growth exceeding 10%, well above the 6-7% long-term average. Labor market metrics reflect moderation rather than deterioration, with private sector job creation maintaining levels above the 100,000-120,000 monthly threshold required to accommodate labor force expansion.
Monetary policy positioning, while restrictive, appears unlikely to tighten further. Financial condition indicators remain generally supportive, with high-yield credit spreads – which typically function as early warning indicators for economic stress – maintaining historically tight ranges that do not yet signal significant concern.
The persistence of trade policy uncertainty makes V-shaped market recovery improbable in the immediate term. However, historical precedent suggests current pullbacks may present accumulation opportunities for strategic positioning if earnings and economic growth remain positive. Current sentiment deterioration creates asymmetric potential for positive surprises if developments prove less negative than current pricing implies.
From an allocation perspective, the year's rotation from previous market laggards to former underperformers likely continues, though with substantial variance based on trade tension evolution. Balanced exposure between growth and value factors provides optimal positioning in this environment. Sectors with minimal tariff exposure and attractive valuations – particularly healthcare and financials – offer compelling risk-adjusted return potential. Financial equities may benefit disproportionately from potential pro-growth policies that could emerge as the administration pivots from trade to broader economic priorities.
Multi-asset diversification has rarely been more critical for navigating current volatility regimes. Fixed-income allocations provide essential portfolio stabilization during equity market dislocations, while the unusually wide range of potential outcomes emphasizes the importance of disciplined long-term positioning rather than reactive tactical shifts based on headline catalysts.
Strategic Framework: Volatility as Opportunity
The recent correction reflects legitimate concerns regarding trade policy implications and inflation persistence. However, these developments should be contextualized within an economy demonstrating fundamental resilience. Corporate profitability maintains structural integrity, labor markets show moderation rather than collapse, and monetary policy, while restrictive, is not actively tightening.

As implementation details crystallize in coming weeks, markets will recalibrate from speculation-driven positioning to evidence-based assessment of economic impact. This process will likely generate continued volatility but ultimately create tactical opportunities for those maintaining discipline and focusing on fundamental value rather than price action.
The leadership transition from growth to value and the correction in technology momentum stocks represents healthy market rebalancing rather than necessarily indicating broader economic distress. While tactical caution remains warranted given the fluid policy environment and mixed economic signals, the structural foundation for continued expansion and eventual market recovery remains intact for patient, disciplined investors capable of distinguishing between noise and signal.

5-Day Futures Performance Leaders
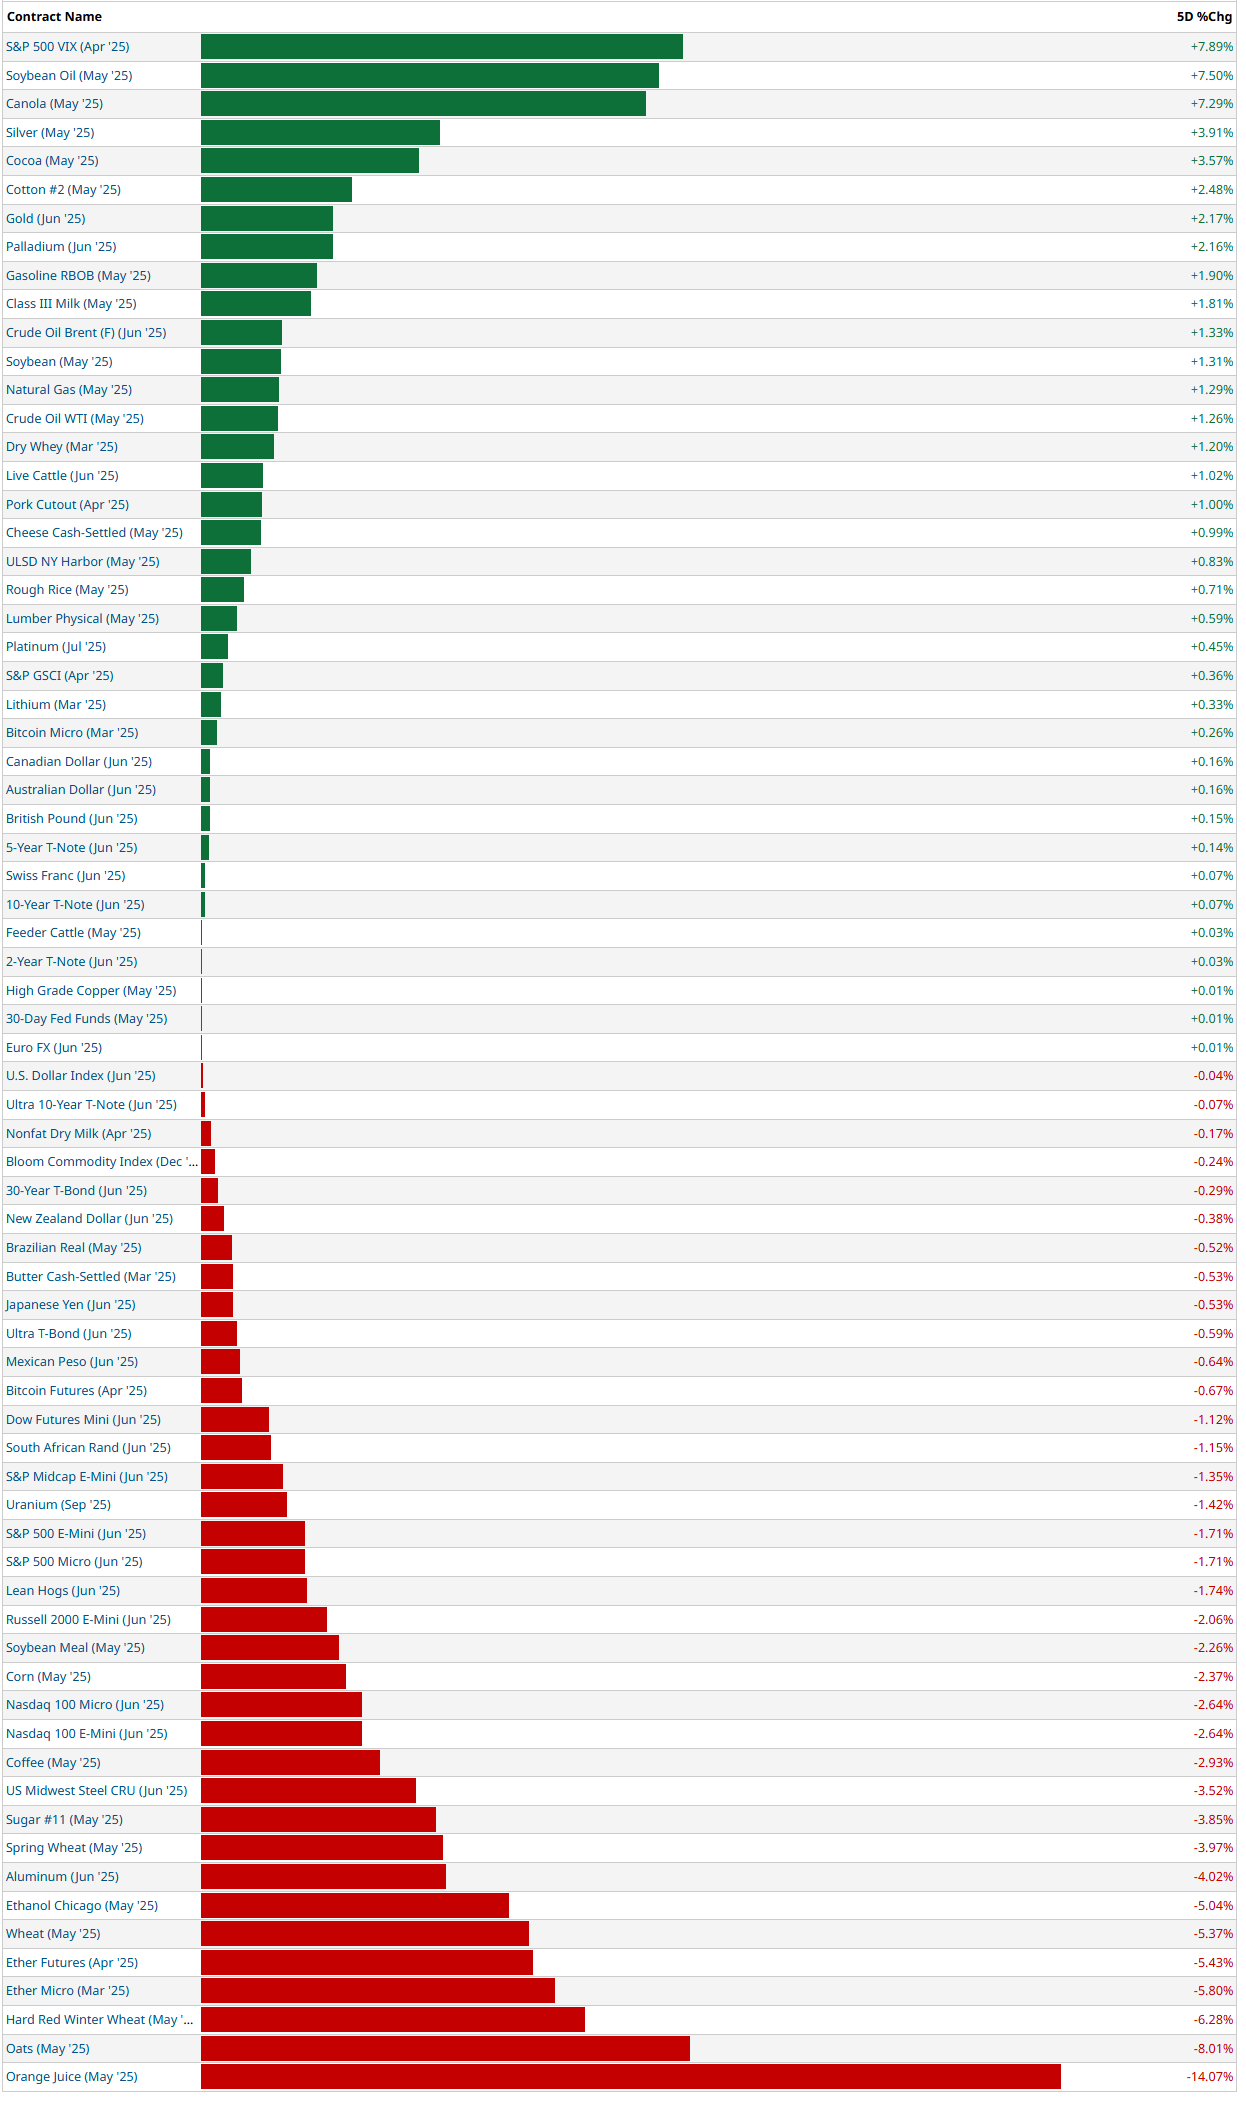
📈 Top Gainers:
Soybeans, Canola, and Other Agricultural Commodities
Concerns over dry weather in Brazil affecting crop yields have supported prices for soybeans and canola.
Silver and Gold
Rising geopolitical tensions and expectations for rate cuts later this year increased safe-haven demand.
S&P 500 VIX (Volatility Index)
Volatility surged after a sharp tech-led pullback in equities, especially with the Fed's cautious tone around interest rates. This unexpected rise in inflation, combined with disappointing consumer sentiment and the announcement of new tariffs, also contributed to significant market volatility
📉 Top Losers:
Orange Juice
Prices fell sharply after forecasts of higher-than-expected Florida orange production eased supply concerns.
Ether (ETH) Futures
Ethereum experienced a selloff due to profit-taking and concerns about upcoming regulatory measures on staking.
Wheat & Oats
A combination of improving crop conditions in the U.S. Midwest and lower export demand pushed prices down.
Coffee & Sugar
Brazil’s improved weather forecasts led to expectations of higher production in the coming season.
S&P 500 Sector Insights

Consumer Discretionary:
Performance: The sector faced significant challenges, primarily due to President Donald Trump's announcement of a 25% tariff on imported cars and light trucks, effective April 3. Major automakers, including General Motors and Ford, saw their shares drop significantly. Conversely, Tesla experienced a slight increase due to its domestic production focus. Companies like Lululemon Athletica and Oxford Industries reported notable declines, attributed to consumer concerns about inflation and economic conditions.
Technology:
The technology sector exhibited mixed results throughout the week. Earlier in the week, tech giants like Nvidia and Tesla rallied, contributing to a 1.76% rise in the S&P 500 on Monday. However, the sector faced headwinds later in the week due to ongoing trade uncertainties and concerns over high valuations. For instance, Broadcom Inc.'s stock fell by 4.1%, underperforming its competitors.
Energy:
The energy sector lagged, influenced by fluctuating oil prices and global demand concerns. Investors showed caution, leading to underperformance in energy stocks compared to other sectors.
Utilities:
As a traditionally defensive sector, utilities outperformed amid market volatility.Companies like American Water Works saw gains, indicating a shift toward stable, recession-proof investments during uncertain economic times.
Communication Services:
The sector had a mixed week, with some companies benefiting from increased demand for digital services. While certain stocks in this sector saw gains, others faced challenges due to broader market conditions and investor sentiment.
Financials:
The financial sector experienced declines, influenced by market volatility and economic slowdown fears. Concerns over interest rates and loan demand impacted bank stocks, contributing to the sector's underperformance.
Consumer Staples:
This defensive sector showed resilience, with modest gains amid broader market declines. The shift toward consumer staples reflects investor preference for sectors perceived as safer during economic uncertainties.
5-Day Sector Leaderboard

5-Day Individual Performance Grouped By Sector (Size By Market Cap)

ETF Insights
Reviewing a heatmap like this weekly can be incredibly helpful for investors as it provides a quick and visual summary of market performance across various sectors, asset classes, and geographies.
1. Sector and Asset Class Trends
Identify Strong and Weak Sectors: Investors can quickly spot which sectors (e.g., technology, energy, healthcare) are performing well or underperforming.
Asset Class Diversification: Seeing how commodities, fixed income, equities, and cryptocurrencies performed helps assess diversification.
2. Market Sentiment
Risk-On or Risk-Off: A green-dominated map suggests bullish sentiment, while red indicates bearish sentiment. Investors can align their strategies accordingly.
Volatility Indicators: Observing movements in volatility indices (e.g., VIX) can highlight changing market dynamics.
3. Regional Analysis
Global Insights: Performance in developed and emerging markets (e.g., Europe, China, Asia-Pacific) helps in gauging international investment opportunities or risks.
Currency Impacts: Movements in forex or country-specific ETFs can indicate currency-driven market trends.
4. Thematic Trends
Growth vs. Value: Comparing the performance of growth ETFs (e.g., VUG) versus value ETFs (e.g., VTV) reveals the prevailing market preference.
Industry Leadership: Highlighting leadership within industries (e.g., gold miners, semiconductors) can inform thematic plays.
5. Monitoring Investments
Portfolio Alignment: Investors can track how their existing investments or watchlist align with broader market trends.
Rotation Signals: Seeing week-over-week changes in sector dominance may signal sector rotation opportunities.
6. Risk Management
Recognizing Overbought/Oversold Conditions: Consistent underperformance or overperformance in specific areas may indicate potential mean-reversion trades.
Correlation Awareness: By observing how different asset classes move, investors can manage portfolio correlation and risk.
7. Decision Support
Identify Outperformers/Underperformers: ETFs, sectors, or indices that repeatedly outperform or underperform can help refine trading or investment strategies.
Macro Perspective: Weekly trends highlight macroeconomic or geopolitical influences affecting markets.
Regularly reviewing a heatmap like this is a strategic practice that supports data-driven decision-making while fostering a holistic understanding of market dynamics.

Broad Market ETFs:
SPDR S&P 500 ETF Trust (SPY): Closed at $555.66, down 1.98% for the week, mirroring the S&P 500's overall decline.
Invesco QQQ Trust (QQQ): Ended at $468.94, a 2.63% decrease, reflecting the tech sector's volatility.
iShares Russell 2000 ETF (IWM): Finished at $200.45, down 2.02%, indicating challenges among small-cap stocks.
Sector-Specific ETFs:
Technology Select Sector SPDR ETF ( XLK 0.00%↑ ): Dropped 2.44% to $206.38, influenced by trade tensions and supply chain concerns.
Consumer Discretionary Select Sector SPDR ( XLY 0.00%↑ ): Fell 3.06% to $197.04, impacted by new tariffs on imported vehicles.
Energy Select Sector SPDR Fund ( XLE 0.00%↑ ): Declined 0.47% to $92.43, amid fluctuating oil prices and global demand worries.
Utilities Select Sector SPDR ETF ( XLU 0.00%↑ ): Rose 0.79% to $77.98, as investors sought defensive positions during market volatility.
Top-Performing ETFs:
Sprott Junior Copper Miners ETF ( COPJ 0.00%↑ ): Gained 14.1%, driven by rising copper prices due to supply concerns.
Amplify Junior Silver Miners ETF ( SILJ 0.00%↑ ): Increased 13.8%, benefiting from heightened demand for silver as a safe-haven asset.TradingView
Global X Defense Tech ETF ( SHLD 0.00%↑ ): Advanced 13.1%, reflecting increased interest in defense technology amid geopolitical tensions.TradingView
Global Overview
Foreign ADR stocks listed on NYSE, NASDAQ & AMEX categorized by geographic location. Reviewing a global heatmap like this weekly is valuable for investors because it offers insights into international markets, helping to:
Identify Global Trends: Spot which regions or countries are performing well or underperforming.
Assess Sector and Regional Performance: Understand how industries are faring across different regions.
Diversify Portfolios: Uncover opportunities in emerging or developed markets for greater diversification.
Gauge Global Sentiment: Recognize the impact of macroeconomic events on specific regions.
Align with Global Strategies: Refine investment strategies based on regional strengths or weaknesses.
This overview ensures investors stay informed about global opportunities and risks, complementing their domestic market analysis.

Top Performers:
DBV Technologies S.A. ( DBVT 0.00%↑ ): The France-based biopharmaceutical company experienced a 59% surge, closing at $6.20. This significant uptick is attributed to positive developments in their allergy treatment pipeline.
Lixiang Education Holding Co. Ltd. ( LXEH 0.00%↑ ): This China-based education services provider saw a 32% increase, ending the week at $17.65. The rise reflects strong earnings and optimistic future enrollment projections.
NuCana PLC ( NCNA 0.00%↑ ): The UK-based biopharmaceutical firm reported a 20% gain, closing at $1.28, likely due to favorable clinical trial results for its oncology treatments.
Top Decliners:
Trident Digital Tech Holdings Ltd. ( $TDTL ): Based in Singapore, the company faced a 34% decline, ending at $0.41. The drop is linked to disappointing quarterly earnings and concerns over digital advertising revenues.
Jianzhi Education Technology Group Co. Ltd. ( JZ 0.00%↑ ): The Chinese education technology firm saw a 16% decrease, closing at $0.77, amid regulatory challenges in China's online education sector.
Quoin Pharmaceuticals Ltd. ( QNRX 0.00%↑ ): The Israel-based pharmaceutical company experienced a 15% drop, ending at $0.24, possibly due to delays in drug approval processes.
Crypto Performance Summary


Market Intelligence Report: An Insider Preview of This Week's Top Institutional Trades
Smart Money's Latest Positions Revealed
Our exclusive institutional trading data has just been updated with thousands of new datapoints…the most significant trades this week represent over $33.6 billion in capital movement in top-ranked trades alone. These aren't retail trades—these are the calculated positions of the world's most sophisticated investors expressing their market thesis through substantial capital deployment, both long and short.
Tech firms saw 23 high-ranked institutional positions worth $1.17B, with AVGO 0.00%↑ (Broadcom) seeing a $1.5B position and MSTR 0.00%↑ (MicroStrategy) with nearly $800M:
Software Infrastructure: Major players have already built MASSIVE positions in $CRWV (25 separate transactions!). Is the first AI pureplay overhyped or a steal at these IPO prices? 🤔
Contradictory Signals: While ADBE 0.00%↑ (Adobe) saw a $716M position, institutions simultaneously poured into bond ETFs TFI 0.00%↑ and VTEB 0.00%↑ with convincing size! Are smart money players hedging tech bets... or rotating capital entirely?
As a matter of fact, Bonds and Consumer Discretionary sectors saw over $3B each in flows. Is smart money hedging for rate risk? Doubling down on a soft-landing bet?
WEX 0.00%↑ shows a fascinating pattern - 4 separate top-5 ranked institutional positions across multiple days. This guy has been trading in one direction for months: straight down. Does someone have an inside-tip on a huge upcoming earnings surprise?

Someone with DEEP pockets just established a position in TQQQ 0.00%↑ with a mind-blowing relative size of 318x the average trade size! That’s big enough to make it into TQQQ’s top-10 largest trades of all time. Meanwhile, PLTR 0.00%↑ saw institutional activity trading 251x its average institutional trade size and TSLA 0.00%↑ clocked its own 118.18x trade.
Inverse tickers like NFXS (1x Bear NFLX) and QID (2x Bear QQQ) cracked top ranks this week as well. Are people piling-in for more turbulence in growth or are they quietly exiting and handing bags off to retail? NFLX earnings are waiting in the wings…

What should really keep you up at night? HOOD 0.00%↑ (Robinhood) saw consecutive day positioning with size. Institutions are back to betting on retail FOMO and capitalizing on retail panic 🚨🚨🚨
