

Fresh Prints
A Midweek Peek At Prints With Potential


We’re back with a special midweek stack we plan on doing from time-to-time called “Fresh Prints”. If you can figure out the pun in the title using the picture above, you’re old but probably smarter than all your friends. And better looking…definitely better looking.
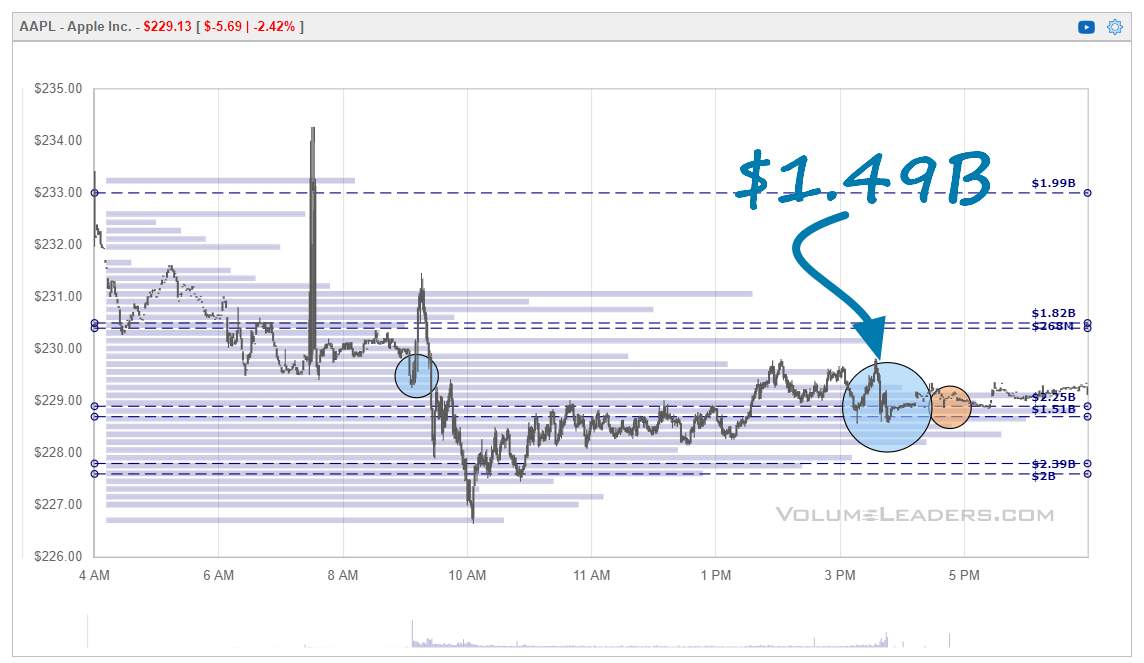
Today we take a look at the stock everyone hates to love and loves to hate: AAPL 0.00%↑. At the bottom of the long-liquidation profile from today, almost dead-center of the HVN at the lows, Apple gifted us a decent block worth $1.49 Billion.
That sounds like a lot of money. You’ll often see trades of this magnitude hyped on social media because, in a general sense, yes, it is indeed a lot of money but they NEVER tell you if it’s a lot of money for Apple. One of the great things about VolumeLeaders.com is that the platform provides the context you need to to discern whether this is rare and significant, worthy of your attention, or merely business as usual.

From the “Trades” summary box, we can quickly size up the trade:
Came in at 4PM EST, the end of the cash session
It was 6.49 million shares
It executed at $228.88
It is worth $1.49 billion
It is 93.27 times larger than the average trade for Apple
It is unranked (not in the top 100 trades for Apple)
The last time a trade of this magnitude hit the tape was…last Thursday 🤣🤣🤣
So this trade is not going to live up to the hype and you can let your favorite furu know. But it’s a good chunk of change that’s been piled on to an area with lots of recent activity and we’re already here, so let’s take a look and see if we like the stonk 😿.

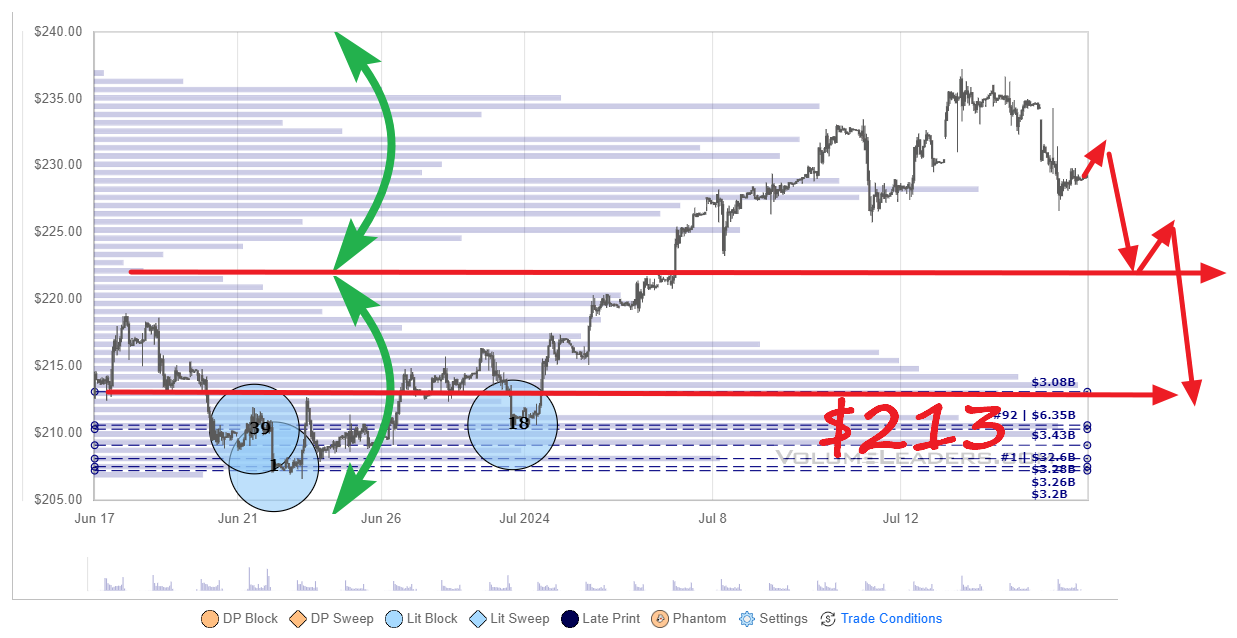
If you open the charts tab in VolumeLeaders.com and select the 30-day timeframe, all of the institutional activity is still piled-in at the lows (red box). You can plainly see two auctions in the image (green rounded arrows highlighting HVNs) have developed, bifurcated by $222.45 (horizontal green arrow in the trough of the LVN). Price action in the upper distribution has currently boxed price in between $226 and $236, roughly. My assessment here is that the distribution isn’t done but if I were long, I have a clear price under which I would exit or trim my position and wait for other opportunities to reengage at lower price.
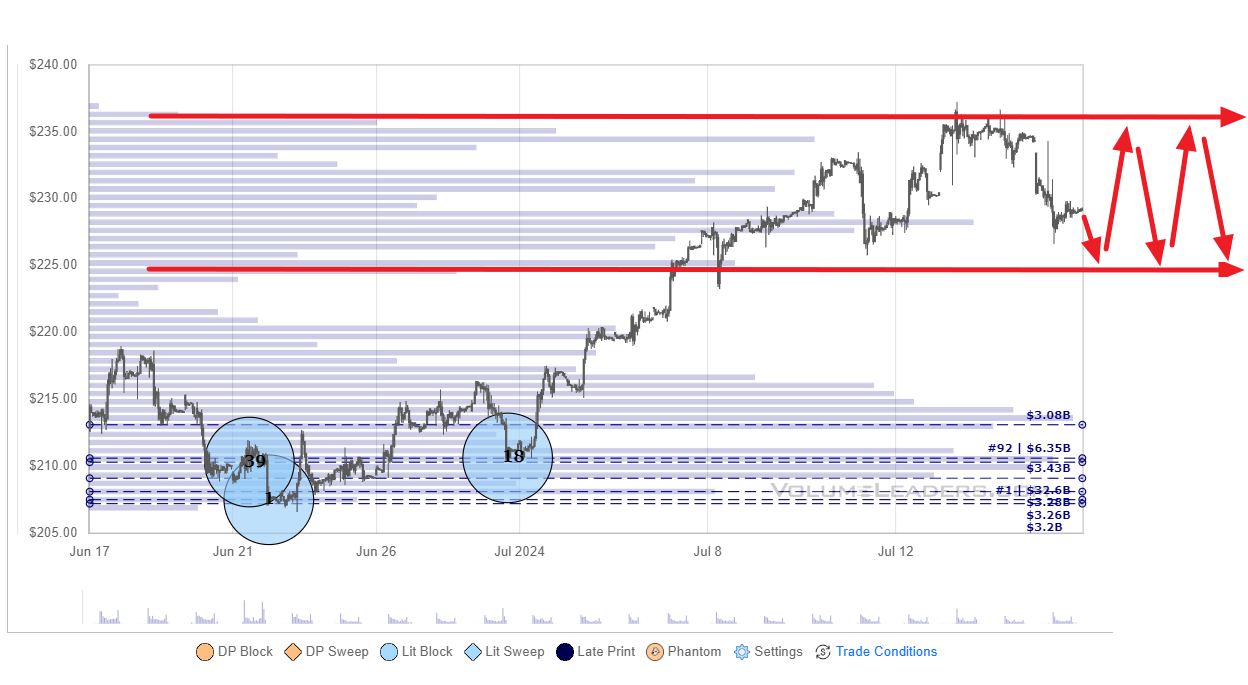
We can change the timeframe on VolumeLeaders.com to the 7-day view to get a more granular view of the upper distribution and track what’s going on:
Now we see the large balance area from the first image breaks down into 3 smaller areas of interest (HVNs indicated by green rounded arrows). Each is boxed-in by institutional activity (exact prices in the green circle at the bottom - mark these on your execution charts), demonstrating the fractal nature of price and auctions across time frames. You can see that this morning’s sell tested into prior positioning and it found a bid - presumably someone is defending, for now.
From these two charts and just a few minutes of our time, a few trade ideas immediately present themselves:
Long Continuation. In this scenario, the market is saying price is still too low and fair value is higher. Today’s dip at the bottom of the current balance area was a discounted buying opportunity and price will traverse the balance area and break out to the topside, seeking the $250 region

Rejection. In this scenario, the market is saying “Look, we thought Apple was worth $230’ish, but all things being what they are now, fair price is actually lower”. The Cocaine Bear has risen from its slumbers and you are seeing today’s price action as an expression of weakness. We should therefore return to a prior area of fair value around $213’ish.
Balance. In this final scenario, you’re neither Bull nor Bear. You agree Apple is fairly priced and therefore expect rangebound action until something comes along that forces the market to reprice things. You play this range outside-in, buying dips into the lows of the box and selling rips into the highs of the box. Kang-gang ftw.
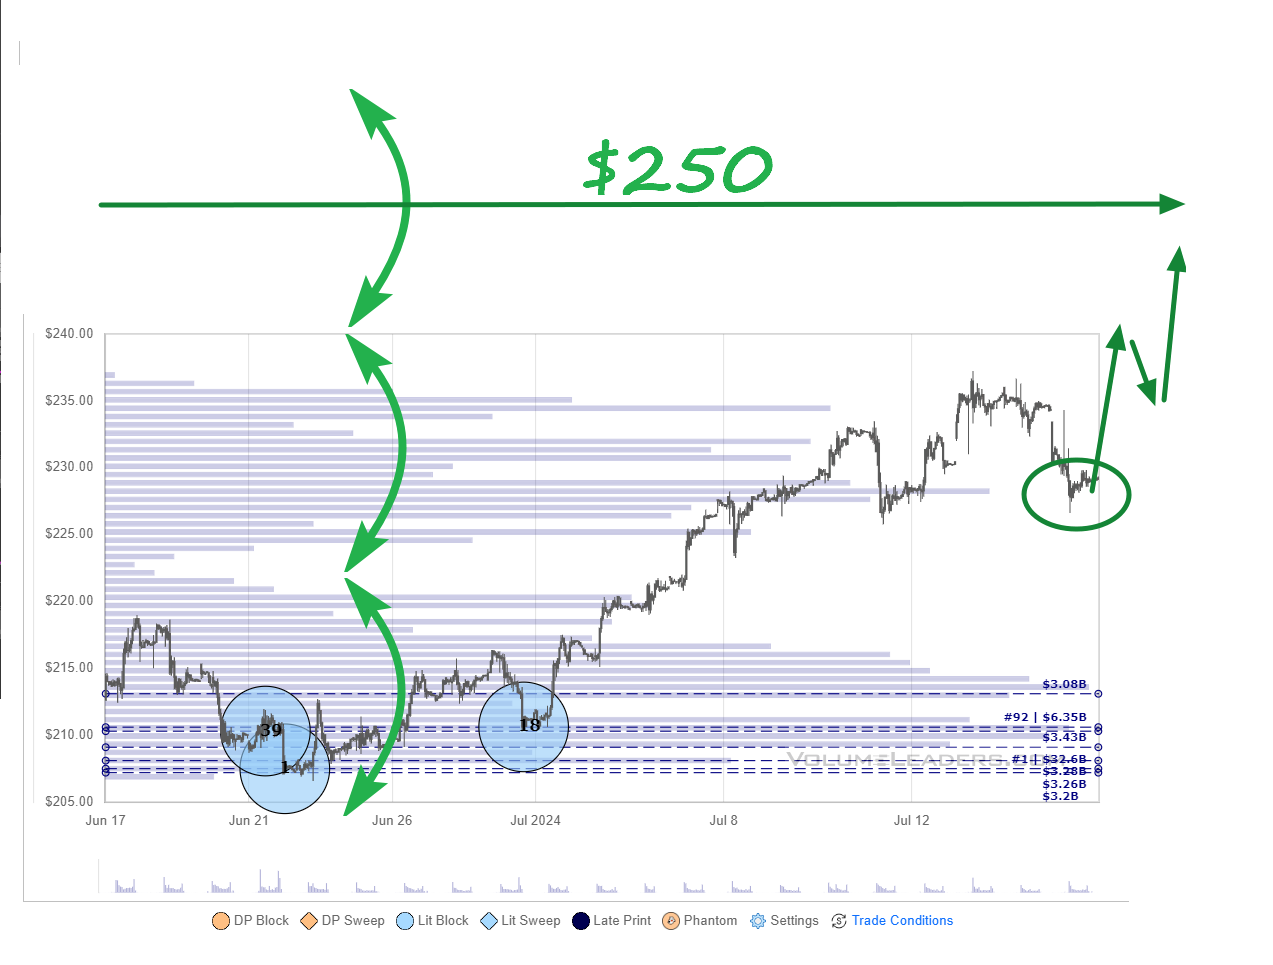


This method of playing zone-to-zone is just one of many ways to trade the prints. The most important thing is to know where the largest players are positioned so you know where to look for reactions in price and can adjust your plan accordingly.
Did you know that there are ETFs like AAPU 0.00%↑ and AAPD 0.00%↑ that institutions use as proxies to express directional bias on Apple? Many stocks have these “proxy tickers” and VolumeLeaders.com tracks those, too. We’ve got traders of all different styles in our Discord where we regularly share and discuss trade ideas and share knowledge like this. Oh, and if you want to know where the #1 print is, you’re going to have to sub or at least sign-up for a trial. It printed within the past few weeks and is only…1345 times larger than the average institutional trade on Apple.

VolumeLeaders.com publishes a weekly substack titled “Market Momentum” that is filled with screened trade ideas, loads of data on institutional positioning and a ton more; you can find the latest issue HERE. Have a look and please consider subscribing for more great content! Until next time, wishing you many bags!